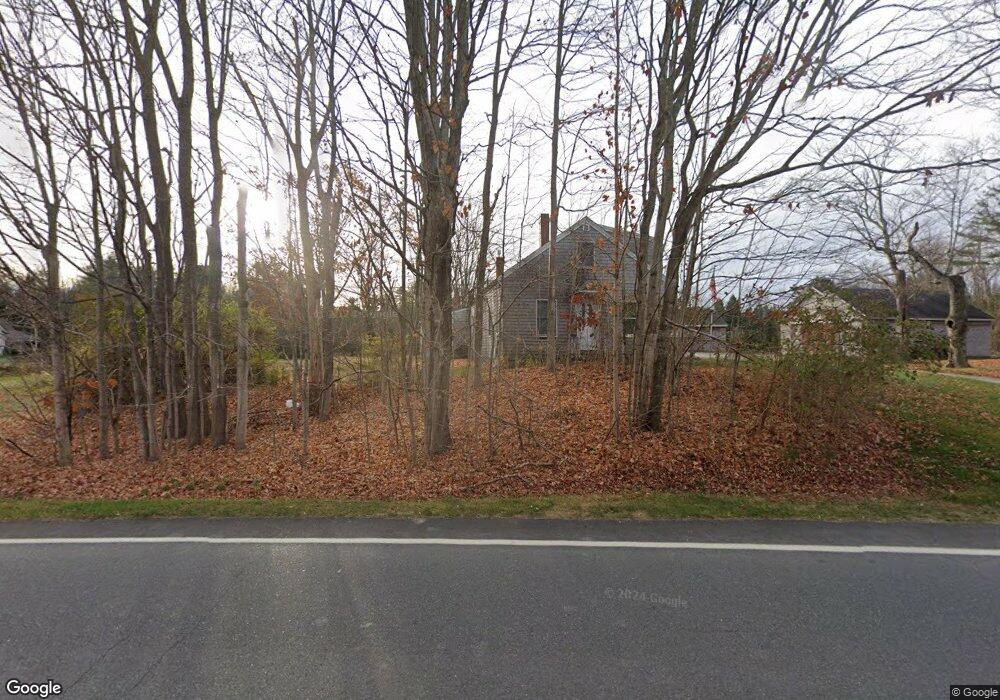
122 Louden Rd Saco, ME 04072
North Saco NeighborhoodEstimated Value: $436,000 - $561,000
3
Beds
1
Bath
1,635
Sq Ft
$302/Sq Ft
Est. Value
About This Home
This home is located at 122 Louden Rd, Saco, ME 04072 and is currently estimated at $493,673, approximately $301 per square foot. 122 Louden Rd is a home located in York County with nearby schools including C K Burns School and Saco Middle School.
Ownership History
Date
Name
Owned For
Owner Type
Purchase Details
Closed on
Apr 15, 2023
Sold by
Trojano Maureen
Bought by
Melevsky David
Current Estimated Value
Purchase Details
Closed on
Nov 6, 2018
Sold by
Frances R Poirier Ret
Bought by
Trojano Maureen
Purchase Details
Closed on
May 3, 2017
Sold by
Poirier Frances R
Bought by
Frances R Poirier Ret and Poirier
Purchase Details
Closed on
Jan 18, 2013
Sold by
Poirier Frances R
Bought by
Poirier Paul G
Create a Home Valuation Report for This Property
The Home Valuation Report is an in-depth analysis detailing your home's value as well as a comparison with similar homes in the area
Home Values in the Area
Average Home Value in this Area
Purchase History
| Date | Buyer | Sale Price | Title Company |
|---|---|---|---|
| Melevsky David | -- | None Available | |
| Melevsky David | -- | None Available | |
| Melevsky David | -- | None Available | |
| Trojano Maureen | -- | -- | |
| Trojano Maureen | -- | -- | |
| Frances R Poirier Ret | -- | -- | |
| Frances R Poirier Ret | -- | -- | |
| Poirier Paul G | -- | -- | |
| Trojano Maureen | -- | -- | |
| Frances R Poirier Ret | -- | -- | |
| Poirier Paul G | -- | -- |
Source: Public Records
Tax History Compared to Growth
Tax History
| Year | Tax Paid | Tax Assessment Tax Assessment Total Assessment is a certain percentage of the fair market value that is determined by local assessors to be the total taxable value of land and additions on the property. | Land | Improvement |
|---|---|---|---|---|
| 2024 | $4,915 | $349,800 | $192,100 | $157,700 |
| 2023 | $5,160 | $349,800 | $192,100 | $157,700 |
| 2022 | $4,988 | $272,100 | $155,600 | $116,500 |
| 2021 | $4,850 | $256,900 | $144,300 | $112,600 |
| 2020 | $4,560 | $231,800 | $126,900 | $104,900 |
| 2019 | $4,492 | $231,800 | $126,900 | $104,900 |
| 2018 | $4,018 | $224,200 | $119,300 | $104,900 |
| 2017 | $3,591 | $211,300 | $112,300 | $99,000 |
| 2016 | $4,426 | $227,900 | $96,000 | $131,900 |
| 2015 | $4,353 | $226,500 | $96,000 | $130,500 |
| 2014 | $4,217 | $226,500 | $96,000 | $130,500 |
| 2013 | $4,390 | $236,300 | $105,800 | $130,500 |
Source: Public Records
Map
Nearby Homes
- 224 New County Rd
- 295 Buxton Rd
- 4 Smutty Ln
- Lot 2 TBD Bobby Ave
- 130 River Rd
- TBD Cribble Cove Rd
- 10 Jeffrey Ave
- 43 New County Rd
- 37 Douglas Ave
- 48 Hillview Ave
- 436 Flag Pond Rd
- 158 Lord Rd
- 4 Spool St Unit 101
- 9 Jada Dr
- 8 Nottingham Dr
- 48 Garfield St Unit 9
- lot 2 June Dr
- 540 South St
- lot 3 June Dr
- 495 South St