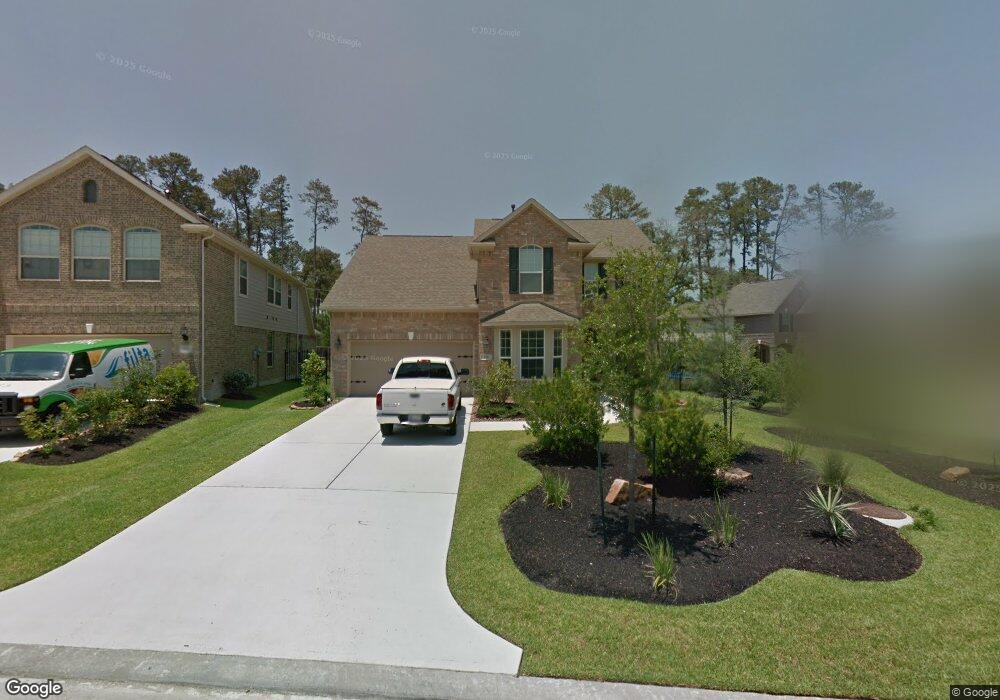
122 Pinto Point Place Spring, TX 77389
Creekside Park NeighborhoodEstimated Value: $587,000 - $667,000
4
Beds
3
Baths
2,571
Sq Ft
$244/Sq Ft
Est. Value
About This Home
This home is located at 122 Pinto Point Place, Spring, TX 77389 and is currently estimated at $627,518, approximately $244 per square foot. 122 Pinto Point Place is a home located in Harris County with nearby schools including Creekside Forest Elementary School, Creekside Park Junior High School, and Tomball High School.
Ownership History
Date
Name
Owned For
Owner Type
Purchase Details
Closed on
Nov 16, 2012
Sold by
Purtle Heather C and Purtle 3 Joseph H
Bought by
Coffey Mary L
Current Estimated Value
Purchase Details
Closed on
May 28, 2010
Sold by
Lennar Homes Of Texas Sales & Marketing
Bought by
Purtle Joseph H and Purtle Heather C
Home Financials for this Owner
Home Financials are based on the most recent Mortgage that was taken out on this home.
Original Mortgage
$226,995
Interest Rate
5.12%
Mortgage Type
FHA
Purchase Details
Closed on
Dec 3, 2009
Sold by
The Woodlands Land Development Company L
Bought by
Lennar Homes Of Texas Land & Constructio
Create a Home Valuation Report for This Property
The Home Valuation Report is an in-depth analysis detailing your home's value as well as a comparison with similar homes in the area
Home Values in the Area
Average Home Value in this Area
Purchase History
| Date | Buyer | Sale Price | Title Company |
|---|---|---|---|
| Coffey Mary L | -- | Texas American Title Company | |
| Coffey Mary L | -- | Texas American Title Company | |
| Purtle Joseph H | -- | North American Title Company | |
| Lennar Homes Of Texas Sales & Marketing | -- | North American Title Company | |
| Lennar Homes Of Texas Land & Constructio | -- | Natc |
Source: Public Records
Mortgage History
| Date | Status | Borrower | Loan Amount |
|---|---|---|---|
| Previous Owner | Purtle Joseph H | $226,995 |
Source: Public Records
Tax History
| Year | Tax Paid | Tax Assessment Tax Assessment Total Assessment is a certain percentage of the fair market value that is determined by local assessors to be the total taxable value of land and additions on the property. | Land | Improvement |
|---|---|---|---|---|
| 2025 | $4,597 | $614,081 | $115,287 | $498,794 |
| 2024 | $4,597 | $557,956 | $100,310 | $457,646 |
| 2023 | $4,597 | $572,381 | $99,614 | $472,767 |
| 2022 | $10,913 | $501,094 | $90,558 | $410,536 |
| 2021 | $10,515 | $390,959 | $90,558 | $300,401 |
| 2020 | $10,377 | $375,559 | $90,558 | $285,001 |
| 2019 | $9,688 | $344,623 | $90,558 | $254,065 |
| 2018 | $2,885 | $372,750 | $90,558 | $282,192 |
| 2017 | $10,504 | $372,750 | $90,558 | $282,192 |
| 2016 | $10,088 | $372,750 | $90,558 | $282,192 |
| 2015 | $5,261 | $372,750 | $90,558 | $282,192 |
| 2014 | $5,261 | $318,780 | $69,660 | $249,120 |
Source: Public Records
Map
Nearby Homes
- 110 N Pinto Point Cir
- 23 S Pinto Point Cir
- 47 Pronghorn Place
- 39 S Pinto Point Cir
- 46 Pronghorn Place
- 39 Pronghorn Place
- 150 Pinto Point Place
- 35 N Beech Springs Cir
- 18 Pronghorn Place
- 94 S Beech Springs Cir
- 241 W Tupelo Green Cir
- 62 N Beech Springs Cir
- 30 Johnathan Landing Ct
- 22 Johnathan Landing Ct
- 6892 Lake Paloma Trail
- 26 Sandwell Place
- 3 S Bayou Club Ct
- 75 S Fremont Ridge Loop
- 7242 Lake Paloma Trail
- 14 Spincaster Dr
- 126 Pinto Point Place
- 118 N Pinto Point Cir
- 130 Pinto Point Place
- 195 N Pinto Point Cir
- 114 N Pinto Point Cir
- 127 Pinto Point Place
- 134 Pinto Point Place
- 131 Pinto Point Place
- 199 Pinto Point Dr
- 15 Galleta Ct
- 11 Galleta Ct
- 138 Pinto Point Place
- 202 Pinto Point Dr
- 203 Pinto Point Dr
- 106 N Pinto Point Cir
- 167 Pinto Point Place
- 142 Pinto Point Place
- 7 Galleta Ct
- 66 S Badger Lodge Cir
- 206 Pinto Point Dr
Your Personal Tour Guide
Ask me questions while you tour the home.