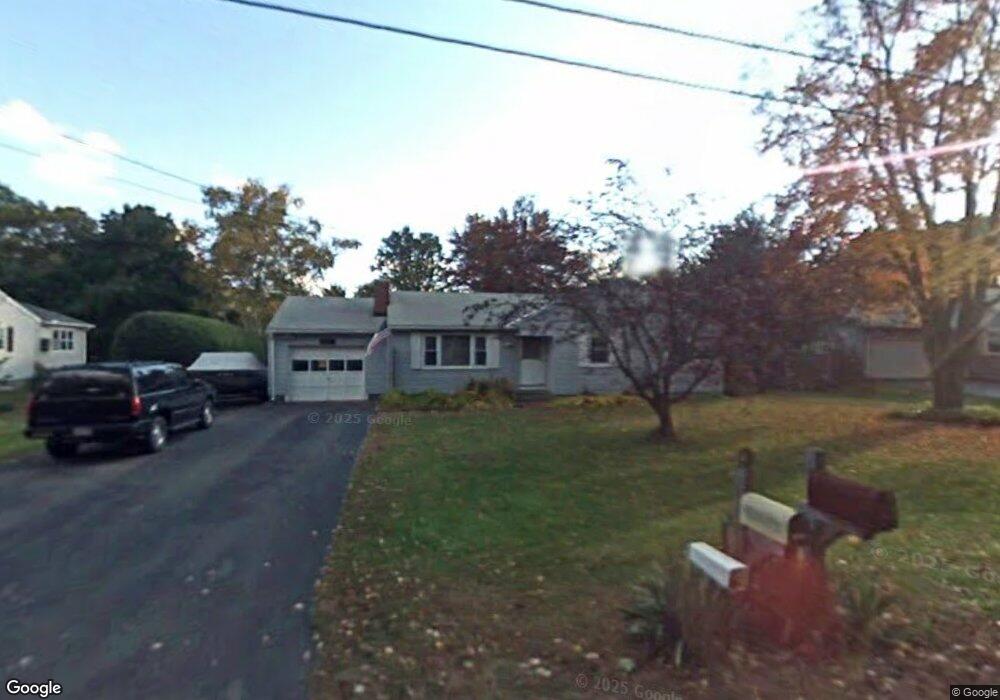
122 Plain St Easthampton, MA 01027
Estimated Value: $337,000 - $393,000
3
Beds
2
Baths
1,124
Sq Ft
$322/Sq Ft
Est. Value
About This Home
This home is located at 122 Plain St, Easthampton, MA 01027 and is currently estimated at $361,582, approximately $321 per square foot. 122 Plain St is a home located in Hampshire County with nearby schools including Easthampton High School, Calvary Baptist Christian School, and Tri-County Schools.
Ownership History
Date
Name
Owned For
Owner Type
Purchase Details
Closed on
Jul 17, 1992
Sold by
Makowicz Patricia M and Makowicz Eugene J
Bought by
Kapinos Frances A and Kapinos Daniel J
Current Estimated Value
Home Financials for this Owner
Home Financials are based on the most recent Mortgage that was taken out on this home.
Original Mortgage
$84,000
Interest Rate
8.54%
Mortgage Type
Purchase Money Mortgage
Create a Home Valuation Report for This Property
The Home Valuation Report is an in-depth analysis detailing your home's value as well as a comparison with similar homes in the area
Home Values in the Area
Average Home Value in this Area
Purchase History
| Date | Buyer | Sale Price | Title Company |
|---|---|---|---|
| Kapinos Frances A | $105,000 | -- |
Source: Public Records
Mortgage History
| Date | Status | Borrower | Loan Amount |
|---|---|---|---|
| Open | Kapinos Frances A | $71,500 | |
| Closed | Kapinos Frances A | $84,000 |
Source: Public Records
Tax History
| Year | Tax Paid | Tax Assessment Tax Assessment Total Assessment is a certain percentage of the fair market value that is determined by local assessors to be the total taxable value of land and additions on the property. | Land | Improvement |
|---|---|---|---|---|
| 2025 | $4,251 | $311,000 | $109,400 | $201,600 |
| 2024 | $4,106 | $302,800 | $106,300 | $196,500 |
| 2023 | $3,120 | $213,000 | $83,500 | $129,500 |
| 2022 | $3,521 | $213,000 | $83,500 | $129,500 |
| 2021 | $3,848 | $219,400 | $83,500 | $135,900 |
| 2020 | $3,783 | $213,000 | $83,500 | $129,500 |
| 2019 | $3,172 | $205,200 | $83,500 | $121,700 |
| 2018 | $3,043 | $190,200 | $78,800 | $111,400 |
| 2017 | $2,973 | $183,400 | $75,800 | $107,600 |
| 2016 | $2,859 | $183,400 | $75,800 | $107,600 |
| 2015 | $2,779 | $183,400 | $75,800 | $107,600 |
Source: Public Records
Map
Nearby Homes
Your Personal Tour Guide
Ask me questions while you tour the home.