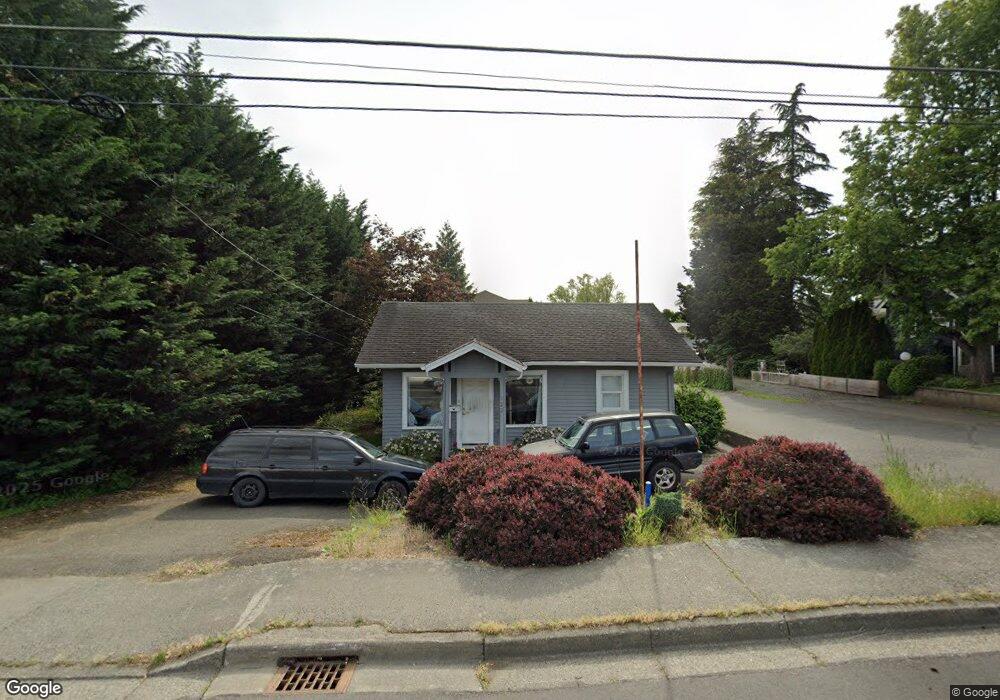
122 S 1st St Lynden, WA 98264
Estimated Value: $398,599 - $430,000
3
Beds
1
Bath
1,034
Sq Ft
$400/Sq Ft
Est. Value
About This Home
This home is located at 122 S 1st St, Lynden, WA 98264 and is currently estimated at $413,650, approximately $400 per square foot. 122 S 1st St is a home located in Whatcom County with nearby schools including Lynden High School, Lynden Christian School, and Lynden Christian Schools: Administration.
Ownership History
Date
Name
Owned For
Owner Type
Purchase Details
Closed on
Sep 1, 2011
Sold by
Federal Home Loan Mortgage Corporation
Bought by
Benson Group Llc
Current Estimated Value
Purchase Details
Closed on
Jun 1, 2010
Sold by
Noble Andrew
Bought by
Federal Home Loan Mortgage Corp
Purchase Details
Closed on
Feb 8, 2006
Sold by
Real Priority Llc
Bought by
Noble Andrew
Home Financials for this Owner
Home Financials are based on the most recent Mortgage that was taken out on this home.
Original Mortgage
$14,750
Interest Rate
5.74%
Mortgage Type
Stand Alone Second
Purchase Details
Closed on
Jun 3, 2003
Sold by
Vanmersbergen Lester J and Vanmersbergen Gretchen S
Bought by
Real Priority Llc
Home Financials for this Owner
Home Financials are based on the most recent Mortgage that was taken out on this home.
Original Mortgage
$104,000
Interest Rate
5.71%
Mortgage Type
Purchase Money Mortgage
Create a Home Valuation Report for This Property
The Home Valuation Report is an in-depth analysis detailing your home's value as well as a comparison with similar homes in the area
Home Values in the Area
Average Home Value in this Area
Purchase History
| Date | Buyer | Sale Price | Title Company |
|---|---|---|---|
| Benson Group Llc | $88,000 | First American Title Ins | |
| Federal Home Loan Mortgage Corp | $140,258 | First American Title Insuran | |
| Noble Andrew | $147,791 | First American Title Insuran | |
| Real Priority Llc | $130,000 | Chicago Title Insurance |
Source: Public Records
Mortgage History
| Date | Status | Borrower | Loan Amount |
|---|---|---|---|
| Previous Owner | Noble Andrew | $14,750 | |
| Previous Owner | Noble Andrew | $118,008 | |
| Previous Owner | Real Priority Llc | $104,000 |
Source: Public Records
Tax History Compared to Growth
Tax History
| Year | Tax Paid | Tax Assessment Tax Assessment Total Assessment is a certain percentage of the fair market value that is determined by local assessors to be the total taxable value of land and additions on the property. | Land | Improvement |
|---|---|---|---|---|
| 2024 | $2,454 | $338,531 | $218,250 | $120,281 |
| 2023 | $2,454 | $340,655 | $225,000 | $115,655 |
| 2022 | $1,475 | $193,051 | $117,332 | $75,719 |
| 2021 | $1,447 | $159,544 | $96,967 | $62,577 |
| 2020 | $1,268 | $142,453 | $86,580 | $55,873 |
| 2019 | $1,128 | $130,712 | $79,495 | $51,217 |
| 2018 | $1,233 | $119,150 | $72,417 | $46,733 |
| 2017 | $1,120 | $106,947 | $65,000 | $41,947 |
| 2016 | $1,068 | $103,355 | $60,500 | $42,855 |
| 2015 | $947 | $97,988 | $58,190 | $39,798 |
| 2014 | -- | $94,662 | $56,210 | $38,452 |
| 2013 | -- | $93,452 | $55,000 | $38,452 |
Source: Public Records
Map
Nearby Homes
- 208 Skipping Stone Loop
- 202 Skipping Stone Loop
- 214 Skipping Stone Loop
- 204 Skipping Stone Loop
- 215 Skipping Stone Loop
- 220 Skipping Stone Loop
- 208 Riverwalk Dr
- 116 Riverwalk Dr
- 205 Riverwalk Dr
- 102 Riverwalk Dr
- 104 Riverwalk Dr
- 231 Skipping Stone Loop
- 205 Pebblebrook Dr
- 204 Pebblebrook Dr
- 207 Pebblebrook Dr
- 126 E Grover St Unit 6
- 206 Pebblebrook Dr
- 211 Pebblebrook Dr
- 706 Judson St Unit B
- 706 Judson St Unit A
- 116 S 1st St
- 130 S 1st St Unit B
- 130 S 1st St Unit A & B
- 130 S 1st St Unit 4A
- 114 S 1st St
- 134 S 1st St Unit B
- 134 S 1st St Unit 134 S First A Lynde
- 134 S 1st St Unit 4B
- 110 S 1st St
- 113 Judson St
- 109 Judson St
- 117 S 1st St
- 106 S 1st St
- 146 S 1st St Unit 201
- 146 S 1st St Unit 102
- 146 S 1st St Unit 101
- 146 S 1st St
- 146 S 1st St Unit 202
- 107 S 1st St
- 158 S 1st St Unit 201