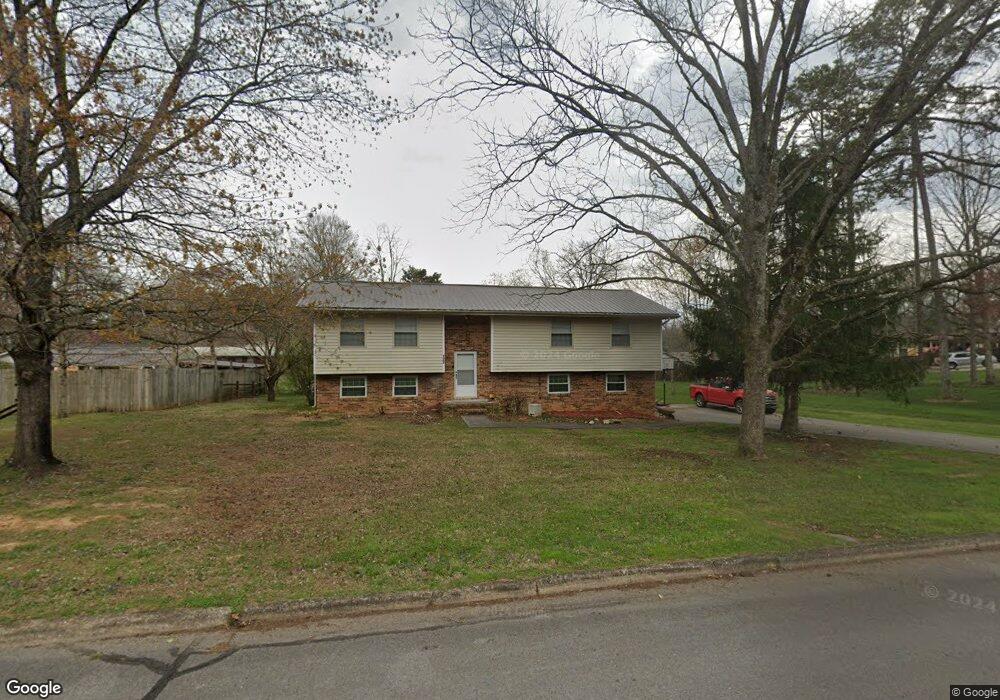
122 Sequoia Dr Athens, TN 37303
Estimated Value: $198,843 - $275,000
Studio
2
Baths
1,416
Sq Ft
$170/Sq Ft
Est. Value
About This Home
This home is located at 122 Sequoia Dr, Athens, TN 37303 and is currently estimated at $240,961, approximately $170 per square foot. 122 Sequoia Dr is a home located in McMinn County with nearby schools including Athens City Middle School and Fairview Christian Academy.
Ownership History
Date
Name
Owned For
Owner Type
Purchase Details
Closed on
Oct 21, 2021
Sold by
Gilley George D and Gilley Patricia E
Bought by
Gilley George D
Current Estimated Value
Home Financials for this Owner
Home Financials are based on the most recent Mortgage that was taken out on this home.
Original Mortgage
$127,500
Interest Rate
5.1%
Mortgage Type
VA
Purchase Details
Closed on
Jul 3, 2001
Sold by
Lathan Richard and Lathan Kathryn
Bought by
Gilley George D
Home Financials for this Owner
Home Financials are based on the most recent Mortgage that was taken out on this home.
Original Mortgage
$87,200
Interest Rate
7.23%
Purchase Details
Closed on
Aug 20, 1991
Bought by
Lathan Richard and Lathan Kathryn
Purchase Details
Closed on
Feb 22, 1990
Bought by
Lundy Jo L Etvir Charles R Seepe
Create a Home Valuation Report for This Property
The Home Valuation Report is an in-depth analysis detailing your home's value as well as a comparison with similar homes in the area
Home Values in the Area
Average Home Value in this Area
Purchase History
| Date | Buyer | Sale Price | Title Company |
|---|---|---|---|
| Gilley George D | -- | None Listed On Document | |
| Gilley George D | $85,500 | -- | |
| Lathan Richard | $68,000 | -- | |
| Lundy Jo L Etvir Charles R Seepe | $55,000 | -- |
Source: Public Records
Mortgage History
| Date | Status | Borrower | Loan Amount |
|---|---|---|---|
| Previous Owner | Gilley George D | $127,500 | |
| Previous Owner | Lundy Jo L Etvir Charles R Seepe | $87,200 |
Source: Public Records
Tax History
| Year | Tax Paid | Tax Assessment Tax Assessment Total Assessment is a certain percentage of the fair market value that is determined by local assessors to be the total taxable value of land and additions on the property. | Land | Improvement |
|---|---|---|---|---|
| 2025 | $875 | $41,875 | $3,025 | $38,850 |
| 2024 | $875 | $41,875 | $3,025 | $38,850 |
| 2023 | $875 | $41,875 | $3,025 | $38,850 |
| 2022 | $781 | $26,975 | $3,025 | $23,950 |
| 2021 | $781 | $26,975 | $3,025 | $23,950 |
| 2020 | $759 | $26,975 | $3,025 | $23,950 |
| 2019 | $759 | $26,975 | $3,025 | $23,950 |
| 2018 | $759 | $26,975 | $3,025 | $23,950 |
| 2017 | $759 | $25,475 | $5,750 | $19,725 |
| 2016 | $759 | $25,475 | $5,750 | $19,725 |
| 2015 | -- | $25,475 | $5,750 | $19,725 |
| 2014 | $700 | $25,465 | $0 | $0 |
Source: Public Records
Map
Nearby Homes
- 806 Towanda Trail
- 1253 Towanda Trail
- 1430 Hammerhill Rd
- 111 Belle Way
- 816 Ivory Rd
- 1706 Chesapeake Dr
- 605 Guille St
- 507 Short St
- 361 Tennessee Ave Unit 307
- 414 Guille St
- 1618 Hogan St
- 118 Highland Ave
- 1215 Jones St
- 303 Blount St
- 908 E Madison Ave
- 112 Peach St Unit st
- 109 Astrid St
- 306 Warren St
- 111 Brown St
- 2429 Cindy St
- 909 Towanda Trail
- 917 Towanda Trail
- 121 Sequoia Dr
- 1912 Seminole Ln
- 832 Topoca Trail
- 108 Sequoia Dr
- 1916 Seminole Ln Unit 1918
- 1908 Seminole Ln
- 912 Towanda Trail
- 916 Towanda Trail
- 111 Sequoia Dr
- 205 Echo Cir
- 810 Towanda Trail
- 201 Echo Cir
- 209 Echo Cir
- 828 Topoca Trail
- 107 Sequoia Dr
- 920 Towanda Trail
- 1005 Towanda Trail
- 1304 Tellico Ave E
Your Personal Tour Guide
Ask me questions while you tour the home.