Estimated Value: $215,000 - $259,000
3
Beds
2
Baths
1,440
Sq Ft
$160/Sq Ft
Est. Value
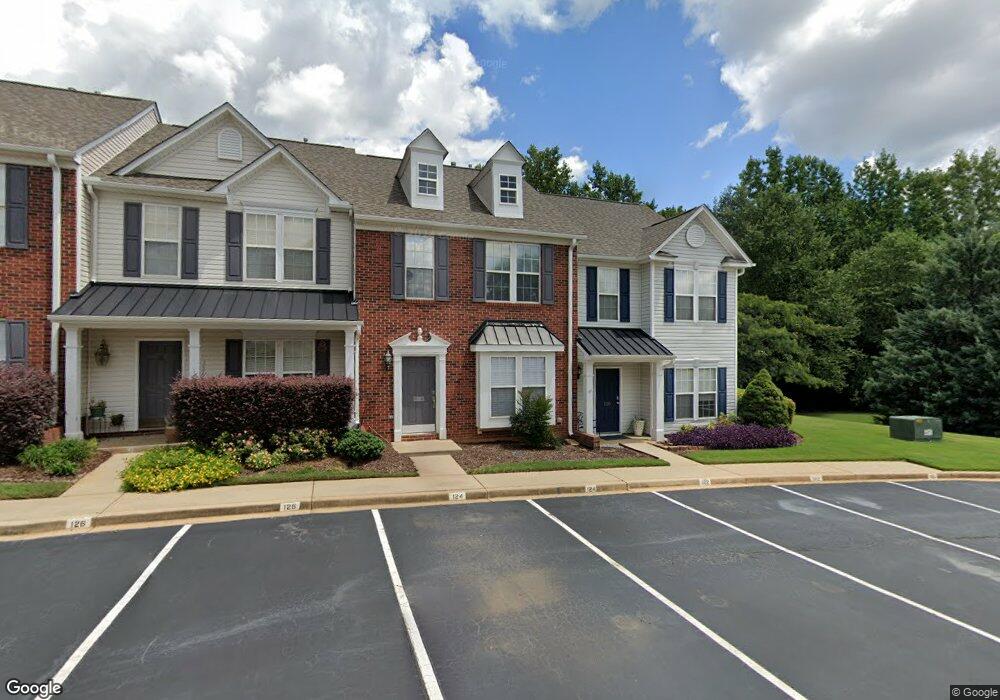
About This Home
This home is located at 122 Spring Crossing Cir, Greer, SC 29650 and is currently estimated at $230,489, approximately $160 per square foot. 122 Spring Crossing Cir is a home located in Greenville County with nearby schools including Woodland Elementary School, Riverside Middle School, and Riverside High School.
Ownership History
Date
Name
Owned For
Owner Type
Purchase Details
Closed on
Sep 1, 2022
Sold by
Sudduth William A
Bought by
Ruppert Joseph Murray
Current Estimated Value
Home Financials for this Owner
Home Financials are based on the most recent Mortgage that was taken out on this home.
Original Mortgage
$152,000
Outstanding Balance
$144,566
Interest Rate
5.54%
Mortgage Type
New Conventional
Estimated Equity
$85,923
Purchase Details
Closed on
Dec 6, 2006
Sold by
Green Michelle L
Bought by
Sudduth William A
Home Financials for this Owner
Home Financials are based on the most recent Mortgage that was taken out on this home.
Original Mortgage
$116,933
Interest Rate
6.29%
Mortgage Type
Purchase Money Mortgage
Purchase Details
Closed on
Oct 16, 2002
Sold by
Nvr Inc A Virginia Corp
Bought by
Green Michelle L
Purchase Details
Closed on
Nov 22, 2000
Sold by
Ring Crossing Llc
Bought by
P Holding I Llc
Create a Home Valuation Report for This Property
The Home Valuation Report is an in-depth analysis detailing your home's value as well as a comparison with similar homes in the area
Home Values in the Area
Average Home Value in this Area
Purchase History
| Date | Buyer | Sale Price | Title Company |
|---|---|---|---|
| Ruppert Joseph Murray | $190,000 | Toates Law Firm Llc | |
| Sudduth William A | $115,500 | None Available | |
| Green Michelle L | $116,637 | -- | |
| P Holding I Llc | -- | -- |
Source: Public Records
Mortgage History
| Date | Status | Borrower | Loan Amount |
|---|---|---|---|
| Open | Ruppert Joseph Murray | $152,000 | |
| Previous Owner | Sudduth William A | $116,933 |
Source: Public Records
Tax History
| Year | Tax Paid | Tax Assessment Tax Assessment Total Assessment is a certain percentage of the fair market value that is determined by local assessors to be the total taxable value of land and additions on the property. | Land | Improvement |
|---|---|---|---|---|
| 2025 | $4,291 | $11,800 | $2,490 | $9,310 |
| 2024 | $4,291 | $10,810 | $1,140 | $9,670 |
| 2023 | $4,250 | $10,810 | $1,140 | $9,670 |
| 2022 | $2,375 | $6,490 | $1,040 | $5,450 |
| 2021 | $2,341 | $6,490 | $1,040 | $5,450 |
| 2020 | $2,118 | $5,640 | $900 | $4,740 |
| 2019 | $2,118 | $5,640 | $900 | $4,740 |
| 2018 | $2,082 | $5,640 | $900 | $4,740 |
| 2017 | $2,050 | $5,640 | $900 | $4,740 |
| 2016 | $1,996 | $94,040 | $15,000 | $79,040 |
| 2015 | $2,071 | $94,040 | $15,000 | $79,040 |
| 2014 | $2,276 | $104,760 | $17,500 | $87,260 |
Source: Public Records
Map
Nearby Homes
- 145 Spring Crossing Cir
- 220 Spring Crossing Cir
- 133 Fawnbrook Dr
- 100 Grey Oak Trail
- 34 Swade Way
- 208 Elise Dr
- 6 Kylemore Ln
- 12 Sabine Leaf Ct
- 519 Longview Terrace
- 44 Riley Eden Ln
- 8 Sunfield Ct
- 76 Riley Eden Ln Unit Site 1
- 68 Riley Eden Ln Unit Site 3
- 210 Alderside Place
- 126 Middleby Way
- 107 Kingscreek Dr
- 310 Cumulus Ct
- 116 Brushy Hollow Ln
- 300 Mansfield Ln
- 109 Quail Creek Dr
- 124 Spring Crossing Cir
- 120 Spring Crossing Cir
- 126 Spring Crossing Cir
- 128 Spring Crossing Cir
- 130 Spring Crossing Cir
- 139 Spring Crossing Cir
- 132 Spring Crossing Cir
- 141 Spring Crossing Cir
- 134 Spring Crossing Cir
- 143 Spring Crossing Cir
- 136 Spring Crossing Cir
- 89 Spring Crossing Cir
- 138 Spring Crossing Cir
- 147 Spring Crossing Cir
- 87 Spring Crossing Cir
- 100 Spring Crossing Cir
- 98 Spring Crossing Cir
- 140 Spring Crossing Cir
- 85 Spring Crossing Cir
- 142 Spring Crossing Cir
Your Personal Tour Guide
Ask me questions while you tour the home.