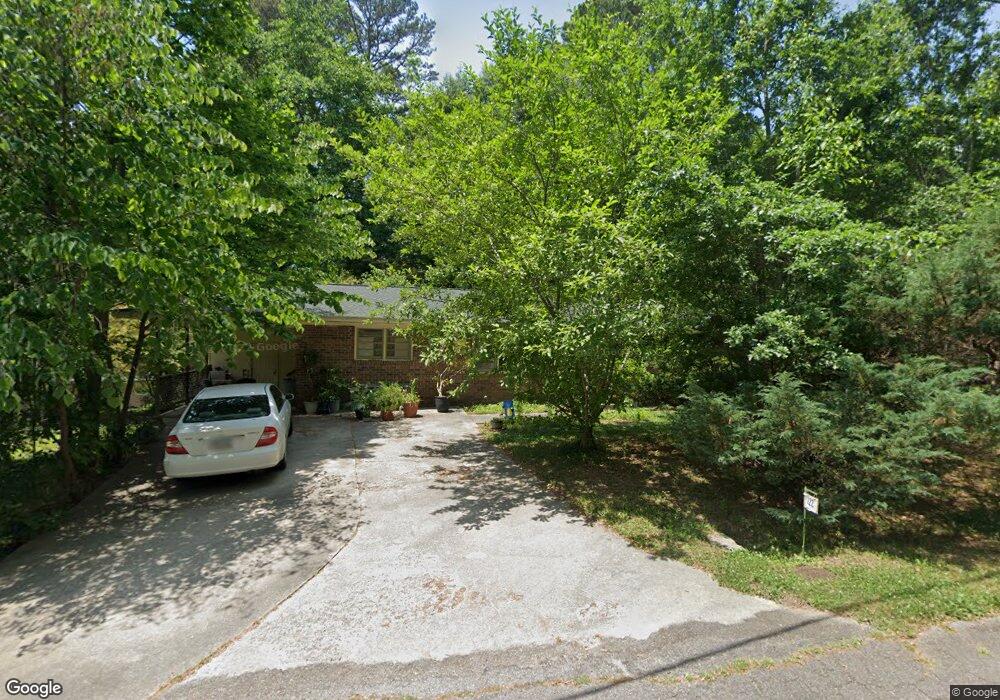
122 Sycamore Cir Toccoa, GA 30577
Estimated Value: $178,190 - $227,000
2
Beds
1
Bath
1,425
Sq Ft
$143/Sq Ft
Est. Value
About This Home
This home is located at 122 Sycamore Cir, Toccoa, GA 30577 and is currently estimated at $203,798, approximately $143 per square foot. 122 Sycamore Cir is a home located in Stephens County with nearby schools including Stephens County High School.
Ownership History
Date
Name
Owned For
Owner Type
Purchase Details
Closed on
Jul 14, 2020
Sold by
Wertan Theresa L
Bought by
Wertan Jackson Bennett
Current Estimated Value
Purchase Details
Closed on
Jan 12, 2010
Sold by
Wertan Lawrence and Wertan Theresa L
Bought by
Wertran Trustees Of Wertran Family Trust
Purchase Details
Closed on
Oct 28, 1999
Sold by
Chase Bank Of Texas
Bought by
Wertan Lawrence and Wertan Theresa L
Purchase Details
Closed on
May 4, 1999
Sold by
Beezley Richard William and Lisa Marie
Bought by
Chase Bank Of Texas
Purchase Details
Closed on
May 29, 1998
Sold by
Coleman Charles David and Martha Sue
Bought by
Beezley Richard William and Lisa Mari
Purchase Details
Closed on
Jul 1, 1994
Sold by
Townsend Judy C
Bought by
Coleman Charles David and Martha Sue
Purchase Details
Closed on
Jan 6, 1981
Sold by
Ivester Michael
Bought by
Ivester Judy C
Purchase Details
Closed on
Feb 19, 1972
Sold by
Martin Realty Company
Bought by
Ivester Michael and Ivester Judy C
Create a Home Valuation Report for This Property
The Home Valuation Report is an in-depth analysis detailing your home's value as well as a comparison with similar homes in the area
Home Values in the Area
Average Home Value in this Area
Purchase History
| Date | Buyer | Sale Price | Title Company |
|---|---|---|---|
| Wertan Jackson Bennett | -- | -- | |
| Wertan Theresa L | -- | -- | |
| Wertran Trustees Of Wertran Family Trust | -- | -- | |
| Wertan Lawrence | $63,400 | -- | |
| Chase Bank Of Texas | -- | -- | |
| Beezley Richard William | $70,000 | -- | |
| Coleman Charles David | $46,000 | -- | |
| Ivester Judy C | -- | -- | |
| Ivester Michael | -- | -- |
Source: Public Records
Tax History Compared to Growth
Tax History
| Year | Tax Paid | Tax Assessment Tax Assessment Total Assessment is a certain percentage of the fair market value that is determined by local assessors to be the total taxable value of land and additions on the property. | Land | Improvement |
|---|---|---|---|---|
| 2024 | $1,282 | $35,967 | $2,146 | $33,821 |
| 2023 | $1,012 | $33,232 | $2,146 | $31,086 |
| 2022 | $930 | $31,236 | $2,146 | $29,090 |
| 2021 | $882 | $28,218 | $2,146 | $26,072 |
| 2020 | $1,072 | $28,535 | $2,146 | $26,389 |
| 2019 | $1,076 | $28,535 | $2,146 | $26,389 |
| 2018 | $22 | $28,448 | $2,146 | $26,302 |
| 2017 | $22 | $28,448 | $2,146 | $26,302 |
| 2016 | $19 | $28,448 | $2,146 | $26,301 |
| 2015 | $20 | $28,380 | $2,146 | $26,233 |
| 2014 | $5 | $27,186 | $2,146 | $25,040 |
| 2013 | -- | $27,186 | $2,146 | $25,040 |
Source: Public Records
Map
Nearby Homes
- 490 Addington Dr
- 189 Julia Ln
- 475 Hilltop Way
- 136 Julia Ct
- 140 Julia Ct
- 372 Hilltop Way
- 739 Poplar St
- 0 Valley Dr Unit 7675761
- 0 Valley Dr Unit 10600268
- 294 Stancil Dr
- 278 Stancil Dr
- 0 Brookhaven Cir Unit 10616964
- 229 Hilltop Ln
- 253 Stancil Dr
- 226 Poplar St
- 151 Rock Creek Rd
- 3013 Hwy 17 A
- 3089 Georgia 17 Alternate
- 59 Sunset Ln
- 0 Switchback Run Unit 10437289
- 0 Sycamore Dr Unit 8732001
- 0 Sycamore Dr Unit 8343948
- 0 Sycamore Dr Unit 8969868
- 0 Sycamore Dr Unit 3264432
- 0 Sycamore Dr Unit 7078188
- 0 Sycamore Dr Unit 7154829
- 0 Sycamore Dr Unit 8110533
- 103 Sycamore Cir
- 104 Sycamore Cir
- 506 Rothell Rd
- 486 Rothell Rd
- 125 Sycamore Cir
- 113 Sycamore Cir
- 306 Rothell Rd
- 526 Rothell Rd
- 139 Sycamore Cir
- 462 Rothell Rd
- 26 Sycamore Dr
- 3 Sycamore Dr
- 63 Sycamore Cir Unit 225-226