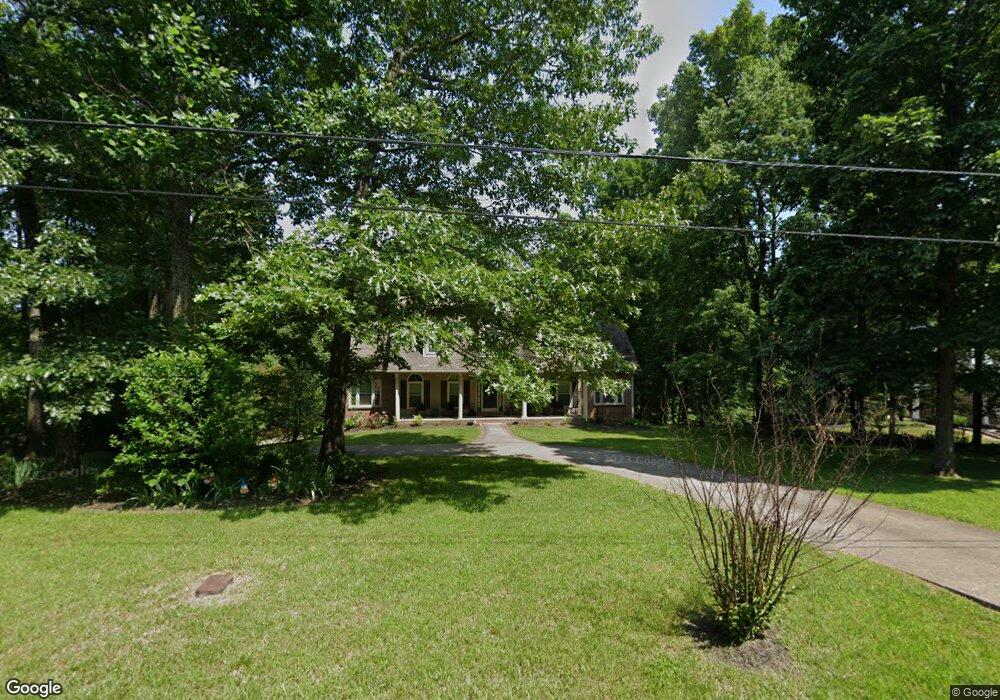
122 Tanglewood Dr Dickson, TN 37055
Estimated Value: $561,189 - $684,000
--
Bed
4
Baths
2,431
Sq Ft
$263/Sq Ft
Est. Value
About This Home
This home is located at 122 Tanglewood Dr, Dickson, TN 37055 and is currently estimated at $640,396, approximately $263 per square foot. 122 Tanglewood Dr is a home located in Dickson County with nearby schools including Centennial Elementary School, Dickson Middle School, and Dickson County High School.
Ownership History
Date
Name
Owned For
Owner Type
Purchase Details
Closed on
Aug 29, 2013
Sold by
Wright Michael A
Bought by
Wright Michael A and Wright Stephanie G
Current Estimated Value
Purchase Details
Closed on
Aug 14, 2013
Sold by
Wright Michael A
Bought by
Ricchey Mary Martha
Purchase Details
Closed on
Feb 4, 2010
Sold by
Hsbc Mortgage Svcs Inc
Bought by
Wright Michael A
Home Financials for this Owner
Home Financials are based on the most recent Mortgage that was taken out on this home.
Original Mortgage
$191,200
Interest Rate
4.97%
Purchase Details
Closed on
May 31, 2006
Sold by
Ralph Jeff T
Bought by
Shaffer Allen
Home Financials for this Owner
Home Financials are based on the most recent Mortgage that was taken out on this home.
Original Mortgage
$287,000
Interest Rate
6.51%
Purchase Details
Closed on
Jul 15, 1994
Bought by
Pruett C K
Purchase Details
Closed on
Feb 15, 1976
Bought by
Dumar Developers Inc
Create a Home Valuation Report for This Property
The Home Valuation Report is an in-depth analysis detailing your home's value as well as a comparison with similar homes in the area
Home Values in the Area
Average Home Value in this Area
Purchase History
| Date | Buyer | Sale Price | Title Company |
|---|---|---|---|
| Wright Michael A | -- | -- | |
| Ricchey Mary Martha | -- | -- | |
| Wright Michael A | $239,000 | -- | |
| Shaffer Allen | $305,500 | -- | |
| Pruett C K | $22,500 | -- | |
| Dumar Developers Inc | -- | -- |
Source: Public Records
Mortgage History
| Date | Status | Borrower | Loan Amount |
|---|---|---|---|
| Previous Owner | Dumar Developers Inc | $191,200 | |
| Previous Owner | Dumar Developers Inc | $287,000 |
Source: Public Records
Tax History Compared to Growth
Tax History
| Year | Tax Paid | Tax Assessment Tax Assessment Total Assessment is a certain percentage of the fair market value that is determined by local assessors to be the total taxable value of land and additions on the property. | Land | Improvement |
|---|---|---|---|---|
| 2025 | -- | $155,700 | $0 | $0 |
| 2024 | $3,424 | $155,700 | $14,950 | $140,750 |
| 2023 | $3,424 | $109,600 | $8,425 | $101,175 |
| 2022 | $3,424 | $109,600 | $8,425 | $101,175 |
| 2021 | $3,424 | $109,600 | $8,425 | $101,175 |
| 2020 | $3,424 | $109,600 | $8,425 | $101,175 |
| 2019 | $3,424 | $109,600 | $8,425 | $101,175 |
| 2018 | $3,171 | $86,875 | $7,500 | $79,375 |
| 2017 | $3,171 | $86,875 | $7,500 | $79,375 |
| 2016 | $3,171 | $86,875 | $7,500 | $79,375 |
| 2015 | $2,865 | $73,850 | $7,500 | $66,350 |
| 2014 | $2,865 | $73,850 | $7,500 | $66,350 |
Source: Public Records
Map
Nearby Homes
- 5 Dogwood Ct
- 2 Hickory Hill Dr
- 201 Tanglewood Dr
- 228 Druid Hills Dr
- 1155 Westfield Rd
- 444 Old Pond Ln
- 435 Old Pond Ln
- 445 Old Pond Ln
- 1233 N Charlotte St
- 2 Old Pond Ln
- 4 Old Pond Ln
- 3 Old Pond Ln
- 1236 N Charlotte St
- 471 Old Pond Ln
- 0 Old Pond Ln
- 0 Rouse Rd
- 404 Masters Way
- 1105 N Charlotte St
- 1012 Northside Dr
- 500 Country Club Dr
- 120 Tanglewood Dr
- 401 Dogwood Ct N
- 6 Dogwood Ct
- 119 Tanglewood Dr
- 108 Tanglewood Dr
- 115 Tanglewood Dr
- 211 Scenic Dr
- 421 Dogwood Ct N
- 208 Scenic Dr
- 105 Dogwood Ct
- 221 Scenic Dr
- 212 Scenic Dr
- 218 Scenic Dr
- 103 Dogwood Ct
- 107 Dogwood Ct
- 220 Scenic Dr
- 425 Dogwood Ct N
- 111 Tanglewood Dr
- 224 Scenic Dr
- 7 Dogwood Ct