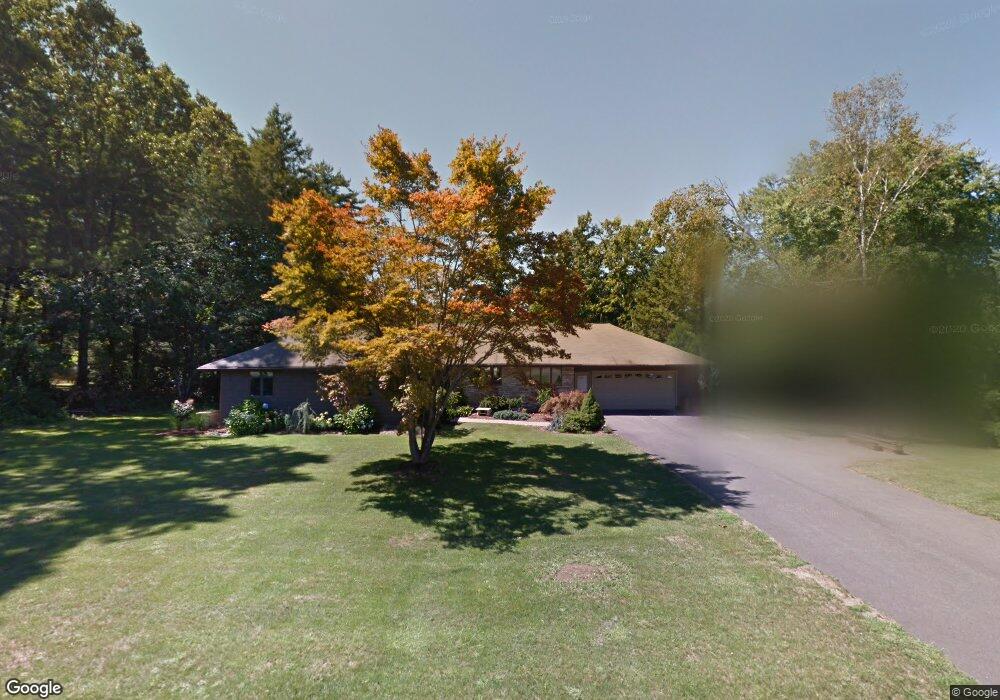
122 Tripp Rd Ellington, CT 06029
Estimated Value: $550,309 - $621,000
3
Beds
3
Baths
2,219
Sq Ft
$265/Sq Ft
Est. Value
About This Home
This home is located at 122 Tripp Rd, Ellington, CT 06029 and is currently estimated at $587,327, approximately $264 per square foot. 122 Tripp Rd is a home located in Tolland County with nearby schools including Ellington High School.
Ownership History
Date
Name
Owned For
Owner Type
Purchase Details
Closed on
Sep 6, 2024
Sold by
Bell Susan T
Bought by
Bell Christopher S and Bell Kevin T
Current Estimated Value
Purchase Details
Closed on
May 31, 2016
Sold by
Bell Steven
Bought by
Bell Susan T
Purchase Details
Closed on
Mar 1, 2000
Sold by
Mackay Donald and Mackay Debra
Bought by
Bell Susan and Bell Steven
Home Financials for this Owner
Home Financials are based on the most recent Mortgage that was taken out on this home.
Original Mortgage
$110,000
Interest Rate
7.5%
Create a Home Valuation Report for This Property
The Home Valuation Report is an in-depth analysis detailing your home's value as well as a comparison with similar homes in the area
Home Values in the Area
Average Home Value in this Area
Purchase History
We collect this data history from publicly available records. To have your information removed, we recommend requesting removal directly through your county’s website.
| Date | Buyer | Sale Price | Title Company |
|---|---|---|---|
| Bell Christopher S | -- | None Available | |
| Bell Susan T | -- | -- | |
| Bell Susan | $211,000 | -- |
Source: Public Records
Mortgage History
We collect this data history from publicly available records. To have your information removed, we recommend requesting removal directly through your county’s website.
| Date | Status | Borrower | Loan Amount |
|---|---|---|---|
| Previous Owner | Bell Susan | $100,000 | |
| Previous Owner | Bell Susan | $100,000 | |
| Previous Owner | Bell Susan | $109,000 | |
| Previous Owner | Bell Susan | $110,000 |
Source: Public Records
Tax History
| Year | Tax Paid | Tax Assessment Tax Assessment Total Assessment is a certain percentage of the fair market value that is determined by local assessors to be the total taxable value of land and additions on the property. | Land | Improvement |
|---|---|---|---|---|
| 2025 | $8,801 | $237,220 | $58,560 | $178,660 |
| 2024 | $8,540 | $237,220 | $58,560 | $178,660 |
| 2023 | $8,137 | $237,220 | $58,560 | $178,660 |
| 2022 | $7,710 | $237,220 | $58,560 | $178,660 |
| 2021 | $7,496 | $237,220 | $58,560 | $178,660 |
| 2020 | $7,064 | $216,680 | $59,050 | $157,630 |
| 2019 | $7,064 | $216,680 | $59,050 | $157,630 |
| 2016 | $6,317 | $207,100 | $59,050 | $148,050 |
| 2015 | $6,601 | $216,430 | $59,050 | $157,380 |
| 2014 | $6,212 | $216,430 | $59,050 | $157,380 |
Source: Public Records
Map
Nearby Homes
- 3 Garnet Ln
- 11 Settlers Way
- 277 Windsorville Rd
- 24 Ellridge Place
- 610 Niederwerfer Rd
- 1 Abbott Rd Unit 112
- 183 Chamberlain Rd
- 0 Thrall Rd Unit 24150600
- 40 Wapping Wood Rd
- 215 Pinney St
- 64 George Dr
- 76 Griffin Rd
- 24 Olive Ln
- 61 Crane Rd
- 87 Jessica Dr
- 2 Christopher Ct
- 85 Franklin St
- 75 Franklin St
- 144 Hany Ln
- 187 Maskel Rd
Your Personal Tour Guide
Ask me questions while you tour the home.