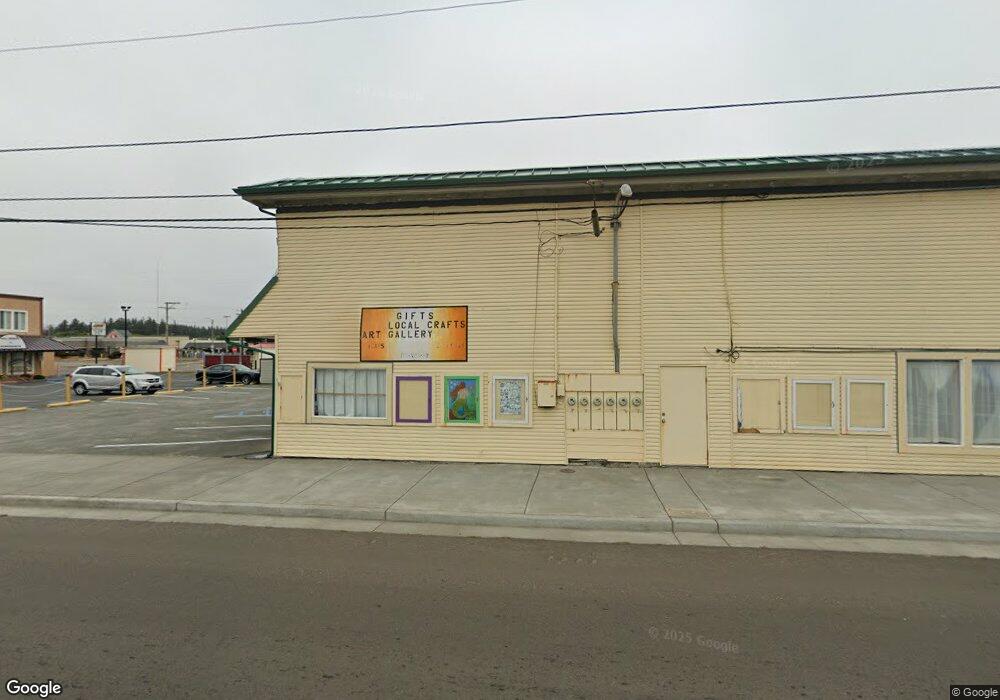
1220 2nd St Crescent City, CA 95531
Estimated Value: $381,734
--
Bed
--
Bath
5,000
Sq Ft
$76/Sq Ft
Est. Value
About This Home
This home is located at 1220 2nd St, Crescent City, CA 95531 and is currently estimated at $381,734, approximately $76 per square foot. 1220 2nd St is a home located in Del Norte County with nearby schools including Joe Hamilton Elementary School, Crescent Elk Middle School, and Del Norte High School.
Ownership History
Date
Name
Owned For
Owner Type
Purchase Details
Closed on
Oct 2, 2025
Sold by
Thompson Bruce B and Lambert Bradley J
Bought by
Sander Nancy R
Current Estimated Value
Purchase Details
Closed on
Aug 20, 2025
Sold by
Sander Nancy R
Bought by
Thompson Bruce B and Lambert Bradley J
Purchase Details
Closed on
Dec 8, 2015
Sold by
Hosshnam Ali and Hooshnam Malihe
Bought by
Sander Thomas M and Sander Nancy R
Purchase Details
Closed on
Nov 17, 2004
Sold by
Vien Beatrice and Tran Loan Kim
Bought by
Hooshnam Ali and Hooshnam Malihe
Create a Home Valuation Report for This Property
The Home Valuation Report is an in-depth analysis detailing your home's value as well as a comparison with similar homes in the area
Home Values in the Area
Average Home Value in this Area
Purchase History
| Date | Buyer | Sale Price | Title Company |
|---|---|---|---|
| Sander Nancy R | -- | None Listed On Document | |
| Thompson Bruce B | -- | None Listed On Document | |
| Sander Thomas M | $183,000 | Crescent Land Title Company | |
| Hooshnam Ali | -- | First American Title Company |
Source: Public Records
Tax History Compared to Growth
Tax History
| Year | Tax Paid | Tax Assessment Tax Assessment Total Assessment is a certain percentage of the fair market value that is determined by local assessors to be the total taxable value of land and additions on the property. | Land | Improvement |
|---|---|---|---|---|
| 2025 | $2,220 | $216,626 | $142,051 | $74,575 |
| 2024 | $2,220 | $212,379 | $139,266 | $73,113 |
| 2023 | $2,173 | $208,216 | $136,536 | $71,680 |
| 2022 | $2,127 | $204,134 | $133,859 | $70,275 |
| 2021 | $2,113 | $200,133 | $131,235 | $68,898 |
| 2020 | $2,099 | $198,082 | $129,890 | $68,192 |
| 2019 | $2,064 | $194,199 | $127,344 | $66,855 |
| 2018 | $2,022 | $190,393 | $124,848 | $65,545 |
| 2017 | $1,989 | $186,660 | $122,400 | $64,260 |
| 2016 | $1,770 | $165,801 | $54,418 | $111,383 |
| 2015 | $1,729 | $163,311 | $53,601 | $109,710 |
| 2014 | $1,713 | $160,113 | $52,552 | $107,561 |
Source: Public Records
Map
Nearby Homes