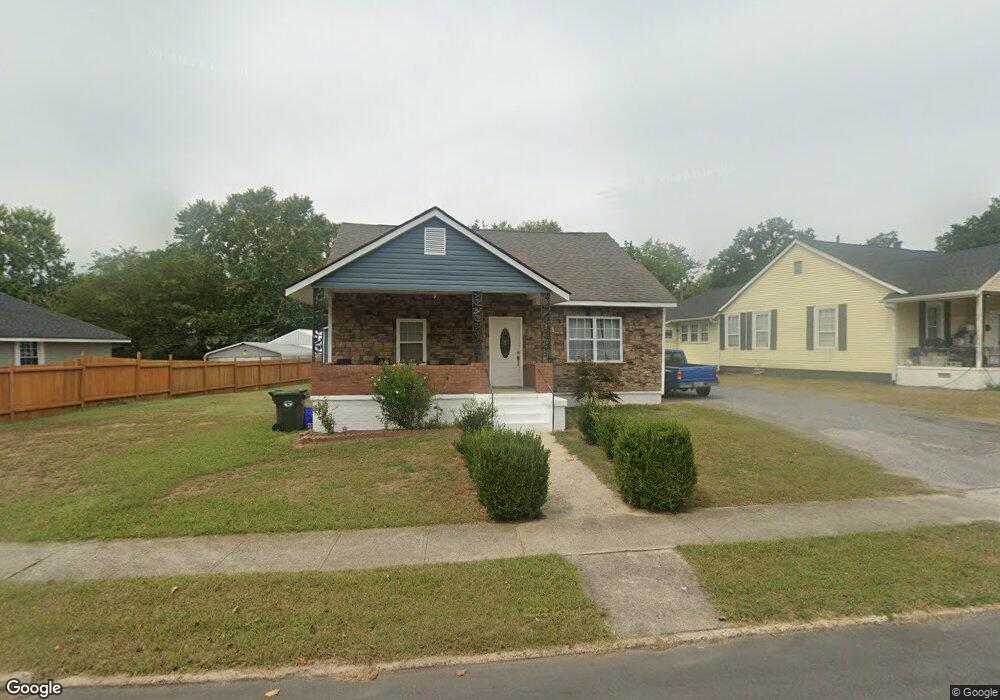
1220 Crescent St Dalton, GA 30720
Estimated Value: $239,658 - $286,000
Studio
1
Bath
2,169
Sq Ft
$119/Sq Ft
Est. Value
About This Home
This home is located at 1220 Crescent St, Dalton, GA 30720 and is currently estimated at $258,415, approximately $119 per square foot. 1220 Crescent St is a home located in Whitfield County with nearby schools including Brookwood Elementary School, Dalton High School, and Rock Hill School.
Ownership History
Date
Name
Owned For
Owner Type
Purchase Details
Closed on
May 14, 2008
Sold by
Porras Maria S
Bought by
Lopez Eva P
Current Estimated Value
Home Financials for this Owner
Home Financials are based on the most recent Mortgage that was taken out on this home.
Original Mortgage
$101,408
Outstanding Balance
$63,003
Interest Rate
5.86%
Mortgage Type
FHA
Estimated Equity
$195,412
Purchase Details
Closed on
Feb 1, 1995
Bought by
Porras Raymundo F and Porras Maria S
Create a Home Valuation Report for This Property
The Home Valuation Report is an in-depth analysis detailing your home's value as well as a comparison with similar homes in the area
Purchase History
| Date | Buyer | Sale Price | Title Company |
|---|---|---|---|
| Lopez Eva P | $103,000 | -- | |
| Porras Maria S | -- | -- | |
| Porras Raymundo F | $58,000 | -- |
Source: Public Records
Mortgage History
| Date | Status | Borrower | Loan Amount |
|---|---|---|---|
| Open | Lopez Eva P | $101,408 |
Source: Public Records
Tax History
| Year | Tax Paid | Tax Assessment Tax Assessment Total Assessment is a certain percentage of the fair market value that is determined by local assessors to be the total taxable value of land and additions on the property. | Land | Improvement |
|---|---|---|---|---|
| 2025 | $2,529 | $87,969 | $4,095 | $83,874 |
| 2024 | $2,529 | $87,969 | $4,095 | $83,874 |
| 2023 | $2,093 | $62,371 | $4,095 | $58,276 |
| 2022 | $1,223 | $42,903 | $4,095 | $38,808 |
| 2021 | $1,225 | $42,903 | $4,095 | $38,808 |
| 2020 | $1,261 | $42,903 | $4,095 | $38,808 |
| 2019 | $837 | $30,461 | $4,095 | $26,366 |
| 2018 | $547 | $22,551 | $4,095 | $18,456 |
| 2017 | $520 | $22,551 | $4,095 | $18,456 |
| 2016 | $460 | $20,881 | $4,095 | $16,786 |
| 2014 | $698 | $28,076 | $4,095 | $23,981 |
| 2013 | -- | $28,076 | $4,095 | $23,980 |
Source: Public Records
Map
Nearby Homes
- 920 Sunset Cir
- 919 Sunset Cir Unit 7
- 0 W Lakeshore Dr Unit 135051
- 804 Thornton Place
- 1709 Needham Dr
- 208 E Walnut Ave
- 924 Stoneleigh Rd
- 903 Hillcrest St
- 703 W Walnut Ave
- 704 W Walnut Ave
- 1230 W Lakeshore Dr W
- 911 Brookwood Dr
- 0 Lakemont Dr Unit 10664970
- 0 Lakemont Dr Unit 1524585
- 0 Lakemont Dr Unit 131479
- 914 W Walnut Ave
- 1300 Belmont Dr
- 1117 Lakemont Dr
- 1301 Swann Dr
- 429 S Glenwood Ave
Your Personal Tour Guide
Ask me questions while you tour the home.