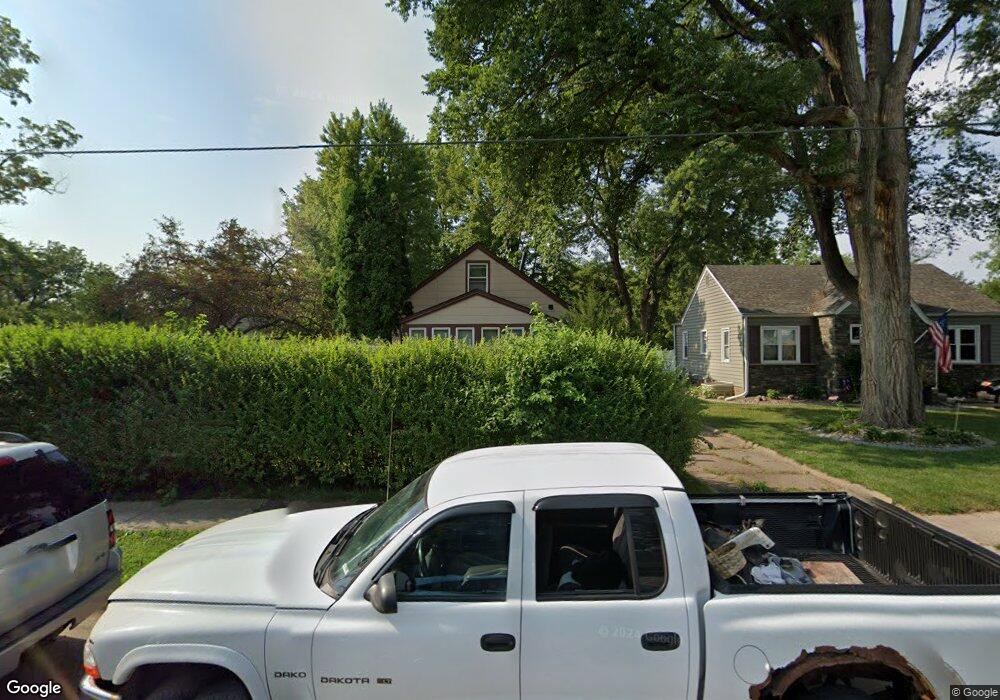
1220 Locust St West Des Moines, IA 50265
Estimated Value: $190,000 - $227,000
2
Beds
1
Bath
905
Sq Ft
$228/Sq Ft
Est. Value
About This Home
This home is located at 1220 Locust St, West Des Moines, IA 50265 and is currently estimated at $206,222, approximately $227 per square foot. 1220 Locust St is a home located in Polk County with nearby schools including Hillside Elementary School, Stilwell Junior High School, and Valley Southwoods Freshman High School.
Ownership History
Date
Name
Owned For
Owner Type
Purchase Details
Closed on
May 7, 2021
Sold by
Perkins David
Bought by
Mcdowell Bobby J and Ridout Betty C
Current Estimated Value
Home Financials for this Owner
Home Financials are based on the most recent Mortgage that was taken out on this home.
Original Mortgage
$140,600
Outstanding Balance
$126,876
Interest Rate
3.1%
Mortgage Type
New Conventional
Estimated Equity
$79,346
Purchase Details
Closed on
Jul 10, 2001
Sold by
Peterson John W and Peterson Jacqueline B
Bought by
Perkins David
Home Financials for this Owner
Home Financials are based on the most recent Mortgage that was taken out on this home.
Original Mortgage
$53,920
Interest Rate
7.27%
Purchase Details
Closed on
Dec 30, 1996
Sold by
Peterson Kurt J
Bought by
Peterson John W and Peterson Jacqueline B
Create a Home Valuation Report for This Property
The Home Valuation Report is an in-depth analysis detailing your home's value as well as a comparison with similar homes in the area
Home Values in the Area
Average Home Value in this Area
Purchase History
| Date | Buyer | Sale Price | Title Company |
|---|---|---|---|
| Mcdowell Bobby J | $148,000 | None Listed On Document | |
| Perkins David | $67,000 | -- | |
| Peterson John W | -- | -- |
Source: Public Records
Mortgage History
| Date | Status | Borrower | Loan Amount |
|---|---|---|---|
| Open | Mcdowell Bobby J | $140,600 | |
| Previous Owner | Perkins David | $53,920 | |
| Closed | Perkins David | $10,110 |
Source: Public Records
Tax History Compared to Growth
Tax History
| Year | Tax Paid | Tax Assessment Tax Assessment Total Assessment is a certain percentage of the fair market value that is determined by local assessors to be the total taxable value of land and additions on the property. | Land | Improvement |
|---|---|---|---|---|
| 2025 | $2,726 | $199,600 | $65,100 | $134,500 |
| 2024 | $2,726 | $182,400 | $59,300 | $123,100 |
| 2023 | $2,722 | $182,400 | $59,300 | $123,100 |
| 2022 | $2,688 | $149,800 | $51,100 | $98,700 |
| 2021 | $2,548 | $149,800 | $51,100 | $98,700 |
| 2020 | $2,506 | $135,700 | $46,500 | $89,200 |
| 2019 | $2,300 | $135,700 | $46,500 | $89,200 |
| 2018 | $2,302 | $120,800 | $40,800 | $80,000 |
| 2017 | $2,174 | $120,800 | $40,800 | $80,000 |
| 2016 | $2,124 | $111,400 | $37,400 | $74,000 |
| 2015 | $2,124 | $111,400 | $37,400 | $74,000 |
| 2014 | $2,022 | $105,400 | $34,900 | $70,500 |
Source: Public Records
Map
Nearby Homes