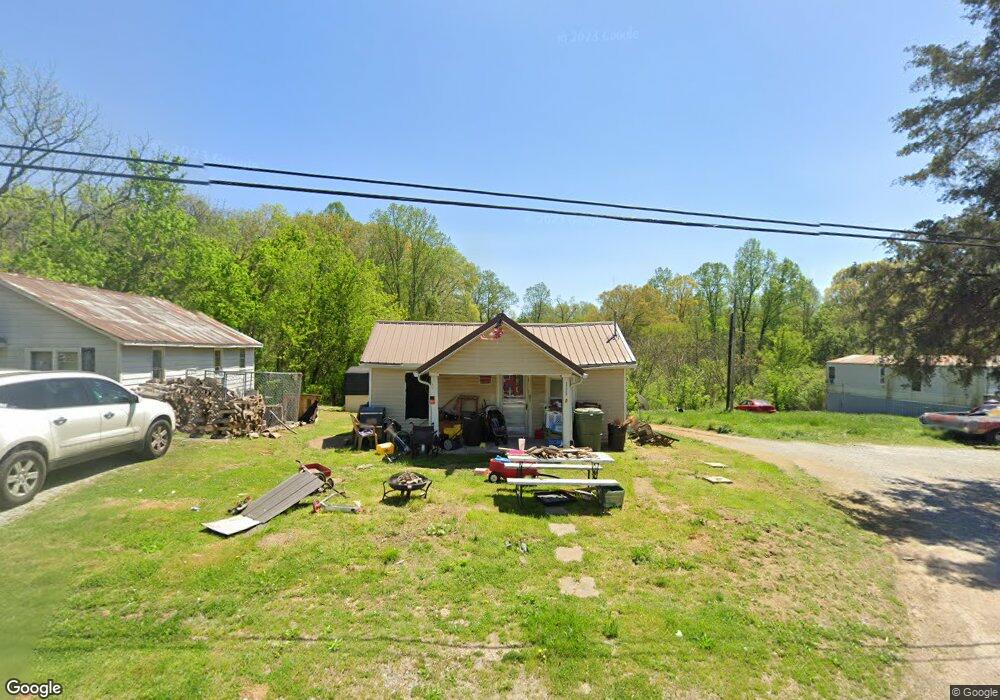
1220 Old Florence Rd Lawrenceburg, TN 38464
Estimated Value: $82,565 - $168,000
--
Bed
1
Bath
850
Sq Ft
$155/Sq Ft
Est. Value
About This Home
This home is located at 1220 Old Florence Rd, Lawrenceburg, TN 38464 and is currently estimated at $131,891, approximately $155 per square foot. 1220 Old Florence Rd is a home located in Lawrence County with nearby schools including Lawrenceburg Public Elementary School, Ingram Sowell Elementary School, and David Crockett Elementary School.
Ownership History
Date
Name
Owned For
Owner Type
Purchase Details
Closed on
Dec 6, 2019
Sold by
Vanderford Harvey and Vanderford Joe
Bought by
Ekklesia Holding Company Llc
Current Estimated Value
Purchase Details
Closed on
Dec 29, 2000
Sold by
Mildred Jester
Bought by
Paige Whitehead Kelli
Purchase Details
Closed on
Jun 24, 1999
Sold by
Josh Duke
Bought by
Harvey Vanderford
Home Financials for this Owner
Home Financials are based on the most recent Mortgage that was taken out on this home.
Original Mortgage
$29,693
Interest Rate
7.23%
Purchase Details
Closed on
May 28, 1999
Sold by
Edward Bailey Charles
Bought by
Josh Duke
Home Financials for this Owner
Home Financials are based on the most recent Mortgage that was taken out on this home.
Original Mortgage
$29,693
Interest Rate
7.23%
Purchase Details
Closed on
May 31, 1966
Bought by
Bailey Charles Edward and Bailey Kathryn L
Create a Home Valuation Report for This Property
The Home Valuation Report is an in-depth analysis detailing your home's value as well as a comparison with similar homes in the area
Home Values in the Area
Average Home Value in this Area
Purchase History
| Date | Buyer | Sale Price | Title Company |
|---|---|---|---|
| Ekklesia Holding Company Llc | $16,500 | None Available | |
| Paige Whitehead Kelli | $77,900 | -- | |
| Harvey Vanderford | $29,500 | -- | |
| Josh Duke | $13,600 | -- | |
| Bailey Charles Edward | -- | -- |
Source: Public Records
Mortgage History
| Date | Status | Borrower | Loan Amount |
|---|---|---|---|
| Previous Owner | Bailey Charles Edward | $29,693 |
Source: Public Records
Tax History Compared to Growth
Tax History
| Year | Tax Paid | Tax Assessment Tax Assessment Total Assessment is a certain percentage of the fair market value that is determined by local assessors to be the total taxable value of land and additions on the property. | Land | Improvement |
|---|---|---|---|---|
| 2025 | $370 | $11,900 | $0 | $0 |
| 2024 | $370 | $11,900 | $1,875 | $10,025 |
| 2023 | $370 | $11,900 | $1,875 | $10,025 |
| 2022 | $370 | $11,900 | $1,875 | $10,025 |
| 2021 | $287 | $6,525 | $1,500 | $5,025 |
| 2020 | $287 | $6,525 | $1,500 | $5,025 |
| 2019 | $287 | $6,525 | $1,500 | $5,025 |
| 2018 | $287 | $6,525 | $1,500 | $5,025 |
| 2017 | $287 | $6,525 | $1,500 | $5,025 |
| 2016 | $287 | $6,525 | $1,500 | $5,025 |
| 2015 | $272 | $6,525 | $1,500 | $5,025 |
| 2014 | $242 | $5,825 | $1,500 | $4,325 |
Source: Public Records
Map
Nearby Homes
- 0 Lexie Ln
- 1291 S Locust Ave
- 407 Oakwood Dr
- 305 Jackie Dr
- 0 Hayes Rd
- 1539 Old Florence Rd
- 330 Cocke St
- 845 Gaither Ave
- 1690 Old Florence Rd
- 511 S Locust Ave
- 0 Stewart St
- 316 S Military Ave
- 336 Jackson Ave
- 220 Jackson Ave
- 220 Lafayette Ave
- 113 W Taylor St
- 213 Pulaski St
- 219 Waterloo St
- 513 Parrish St
- 234 Glenn Springs Rd
- 1212 Old Florence Rd
- 1230 Old Florence Rd
- 1178 Old Florence Rd
- 1235 Old Florence Rd
- 1215 Old Florence Rd
- 1185 Old Florence Rd
- 1174 Old Florence Rd
- 1265 Old Florence Rd
- 1163 Alford St
- 1170 Old Florence Rd
- 1175 Old Florence Rd
- 1161 Hannah St
- 1168 Old Florence Rd
- 0 Virginia Dr
- 1285 Old Florence Rd
- 1325 Old Florence Rd
- 1135 Old Florence Rd
- 181 Prosser Rd
- 165 Prosser Rd
- 1125 Old Florence Rd