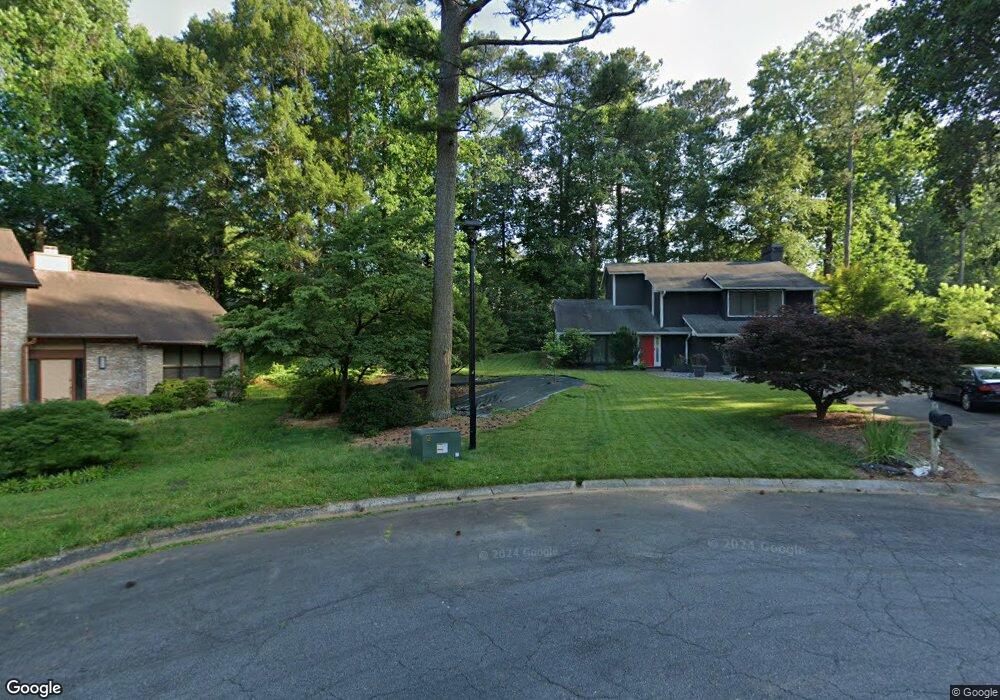
1220 Pimlico Ct Marietta, GA 30062
East Cobb NeighborhoodEstimated Value: $551,000 - $703,000
4
Beds
3
Baths
2,318
Sq Ft
$267/Sq Ft
Est. Value
About This Home
This home is located at 1220 Pimlico Ct, Marietta, GA 30062 and is currently estimated at $617,992, approximately $266 per square foot. 1220 Pimlico Ct is a home located in Cobb County with nearby schools including East Side Elementary School, Dodgen Middle School, and Walton High School.
Ownership History
Date
Name
Owned For
Owner Type
Purchase Details
Closed on
Jan 8, 2021
Sold by
Hoberg Erich M
Bought by
Macartney Julie and Hoberg Erich M
Current Estimated Value
Home Financials for this Owner
Home Financials are based on the most recent Mortgage that was taken out on this home.
Original Mortgage
$281,000
Outstanding Balance
$204,020
Interest Rate
2.71%
Mortgage Type
New Conventional
Estimated Equity
$413,972
Purchase Details
Closed on
Jul 20, 2009
Sold by
Kulcsar Thomas S and Kulcsar Debora K
Bought by
Hoberg Rich M
Home Financials for this Owner
Home Financials are based on the most recent Mortgage that was taken out on this home.
Original Mortgage
$226,816
Interest Rate
5.37%
Mortgage Type
FHA
Purchase Details
Closed on
Nov 8, 1996
Sold by
Silvey Kenneth Brenda F
Bought by
Kulcsar Thomas J
Create a Home Valuation Report for This Property
The Home Valuation Report is an in-depth analysis detailing your home's value as well as a comparison with similar homes in the area
Home Values in the Area
Average Home Value in this Area
Purchase History
| Date | Buyer | Sale Price | Title Company |
|---|---|---|---|
| Macartney Julie | -- | None Available | |
| Hoberg Rich M | $231,000 | -- | |
| Kulcsar Thomas J | $130,500 | -- |
Source: Public Records
Mortgage History
| Date | Status | Borrower | Loan Amount |
|---|---|---|---|
| Open | Macartney Julie | $281,000 | |
| Closed | Hoberg Rich M | $226,816 | |
| Closed | Kulcsar Thomas J | $0 |
Source: Public Records
Tax History Compared to Growth
Tax History
| Year | Tax Paid | Tax Assessment Tax Assessment Total Assessment is a certain percentage of the fair market value that is determined by local assessors to be the total taxable value of land and additions on the property. | Land | Improvement |
|---|---|---|---|---|
| 2025 | $4,673 | $192,928 | $38,000 | $154,928 |
| 2024 | $5,817 | $192,928 | $38,000 | $154,928 |
| 2023 | $4,397 | $145,824 | $32,000 | $113,824 |
| 2022 | $4,426 | $145,824 | $32,000 | $113,824 |
| 2021 | $3,189 | $123,288 | $28,000 | $95,288 |
| 2020 | $3,077 | $118,196 | $34,000 | $84,196 |
| 2019 | $3,077 | $118,196 | $34,000 | $84,196 |
| 2018 | $3,077 | $118,196 | $34,000 | $84,196 |
| 2017 | $2,810 | $111,720 | $34,000 | $77,720 |
| 2016 | $2,813 | $111,720 | $34,000 | $77,720 |
| 2015 | $2,492 | $94,456 | $26,800 | $67,656 |
| 2014 | $2,513 | $94,456 | $0 | $0 |
Source: Public Records
Map
Nearby Homes
- 1200 Mitsy Forest Dr NE
- 3570 Brighton Place
- 1257 Independence Way
- 0 Old Canton Rd NE Unit 10567243
- 0 Old Canton Rd NE Unit 7617214
- 1120 Taliwa Trail NE
- 2994 Octavia Cir
- 718 Trevett Way
- 3700 Robinson Rd NE
- 3506 Clubland Dr Unit 6
- 2880 Octavia Cir
- 2868 Octavia Cir
- 2988 Nestle Creek Dr
- 2903 Ashebrooke Dr NE
- 3495 Mill Bridge Dr Unit 2
- 3792 Raccoon Run
- 860 Mitsy Ridge Dr
- 3542 Clubland Dr
- 1519 Brookcliff Cir
- 1210 Pimlico Ct
- 3363 Preakness Ct
- 3375 Preakness Ct
- 3349 Preakness Ct
- 1260 Murdock Rd
- 1221 Pimlico Ct
- 1274 Murdock Rd
- 3337 Preakness Ct
- 0 Pimlico Ct
- 1211 Pimlico Ct
- 3310 Gulfstream Ln
- 0 Preakness Ct Unit 7438003
- 3330 Gulfstream Ln
- 3386 Preakness Ct
- 1290 Murdock Rd
- 3364 Preakness Ct
- 3352 Preakness Ct Unit 5B
- 0 Gulfstream Ln Unit 7441376
- 0 Gulfstream Ln Unit 8318306
- 0 Gulfstream Ln Unit 7316948