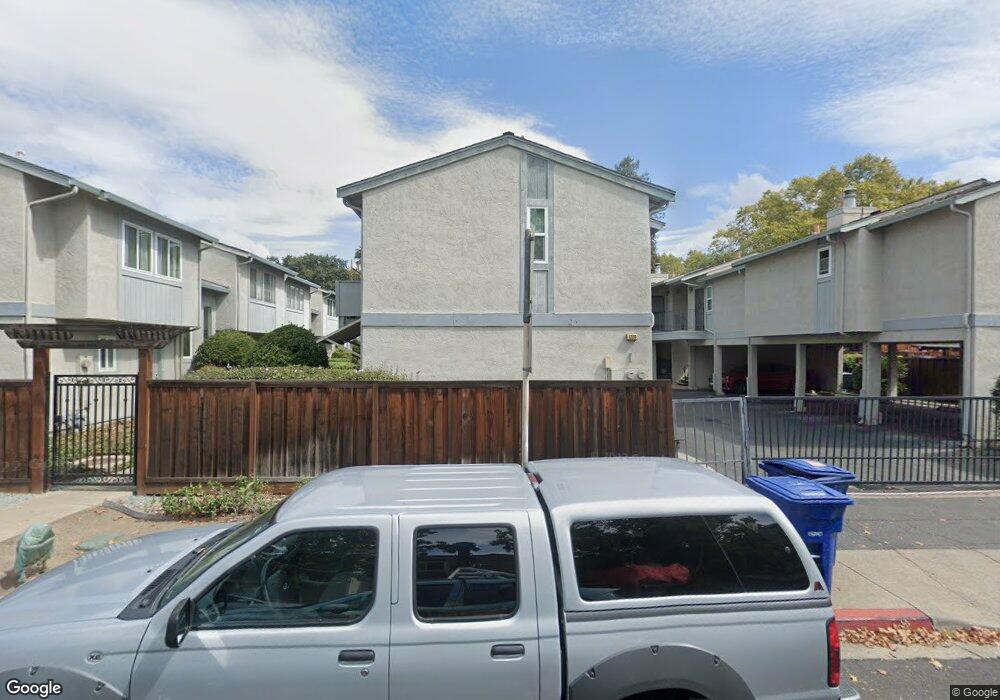
1220 Pine Creek Way Unit 4 Concord, CA 94520
Princess Park NeighborhoodEstimated Value: $471,000 - $507,000
3
Beds
2
Baths
1,262
Sq Ft
$382/Sq Ft
Est. Value
About This Home
This home is located at 1220 Pine Creek Way Unit 4, Concord, CA 94520 and is currently estimated at $482,469, approximately $382 per square foot. 1220 Pine Creek Way Unit 4 is a home located in Contra Costa County with nearby schools including Meadow Homes Elementary School, Oak Grove Middle School, and Mt. Diablo High School.
Ownership History
Date
Name
Owned For
Owner Type
Purchase Details
Closed on
Oct 16, 2019
Sold by
Colligan Tetiana and Colligan Bryan Patrick
Bought by
Muh Shiow Sooe and Shu Shiow May
Current Estimated Value
Purchase Details
Closed on
Mar 24, 2017
Sold by
Bare Ventures Llc
Bought by
Colligan Tetiana and Colligan Bryan Patrick
Home Financials for this Owner
Home Financials are based on the most recent Mortgage that was taken out on this home.
Original Mortgage
$338,000
Interest Rate
4.17%
Mortgage Type
New Conventional
Purchase Details
Closed on
Nov 23, 2016
Sold by
Chang Kuang Hsiong and Chang Hsia Huei
Bought by
Bare Ventures Llc
Purchase Details
Closed on
Sep 12, 2000
Sold by
Chang Kuang Hsiong and Chang Hsia Huei
Bought by
Chang Kuang Hsiong and Chang Hsia Huei
Create a Home Valuation Report for This Property
The Home Valuation Report is an in-depth analysis detailing your home's value as well as a comparison with similar homes in the area
Home Values in the Area
Average Home Value in this Area
Purchase History
| Date | Buyer | Sale Price | Title Company |
|---|---|---|---|
| Muh Shiow Sooe | $390,000 | Placer Title Company | |
| Colligan Tetiana | $350,000 | Fidelity National Title Co | |
| Bare Ventures Llc | $185,000 | Fidelity National Title Co | |
| Chang Kuang Hsiong | -- | -- |
Source: Public Records
Mortgage History
| Date | Status | Borrower | Loan Amount |
|---|---|---|---|
| Previous Owner | Colligan Tetiana | $338,000 |
Source: Public Records
Tax History Compared to Growth
Tax History
| Year | Tax Paid | Tax Assessment Tax Assessment Total Assessment is a certain percentage of the fair market value that is determined by local assessors to be the total taxable value of land and additions on the property. | Land | Improvement |
|---|---|---|---|---|
| 2025 | $5,540 | $426,517 | $148,734 | $277,783 |
| 2024 | $5,427 | $418,155 | $145,818 | $272,337 |
| 2023 | $5,427 | $409,957 | $142,959 | $266,998 |
| 2022 | $5,345 | $401,919 | $140,156 | $261,763 |
| 2021 | $5,205 | $394,039 | $137,408 | $256,631 |
| 2019 | $4,896 | $364,139 | $208,288 | $155,851 |
| 2018 | $4,705 | $357,000 | $204,204 | $152,796 |
| 2017 | $3,327 | $240,000 | $100,000 | $140,000 |
| 2016 | $2,467 | $167,321 | $57,679 | $109,642 |
| 2015 | $2,411 | $164,809 | $56,813 | $107,996 |
| 2014 | $2,343 | $161,582 | $55,701 | $105,881 |
Source: Public Records
Map
Nearby Homes
- 2398 Walters Way Unit 6
- 1241 Pine Creek Way Unit F
- 2450 Walters Way Unit 11
- 1237 Pine Creek Way Unit B
- 1255 Detroit Ave Unit 12
- 2525 Walters Way Unit 22
- 2525 Walters Way Unit 19
- 2030 Riley Ct
- 1140 Detroit Ave Unit 14
- 1990 Sunshine Dr
- 1133 Meadow Ln Unit 53
- 1133 Meadow Ln Unit 38
- 1439 Toyon Dr
- 1750 Diane Ct
- 1470 Detroit Ave Unit E
- 1630 Nicholas Dr
- 2300 Laguna Cir Unit B
- 2300 Laguna Cir
- 2000 Laguna Cir Unit D
- 2500 Laguna Cir Unit H
- 1220 Pine Creek Way Unit 9
- 1220 Pine Creek Way Unit 8
- 1220 Pine Creek Way Unit 7
- 1220 Pine Creek Way Unit 6
- 1220 Pine Creek Way Unit 5
- 1220 Pine Creek Way Unit 3
- 1220 Pine Creek Way Unit 2
- 1220 Pine Creek Way Unit 1
- 1220 Pine Creek Way Unit 10
- 1221 Pine Creek Way Unit G
- 1221 Pine Creek Way Unit F
- 1221 Pine Creek Way Unit E
- 1221 Pine Creek Way Unit C
- 1221 Pine Creek Way Unit B
- 1221 Pine Creek Way Unit A
- 1230 Pine Creek Way
- 1230 Pine Creek Way Unit A
- 1230 Pine Creek Way Unit B
- 1230 Pine Creek Way Unit C
- 1230 Pine Creek Way Unit D