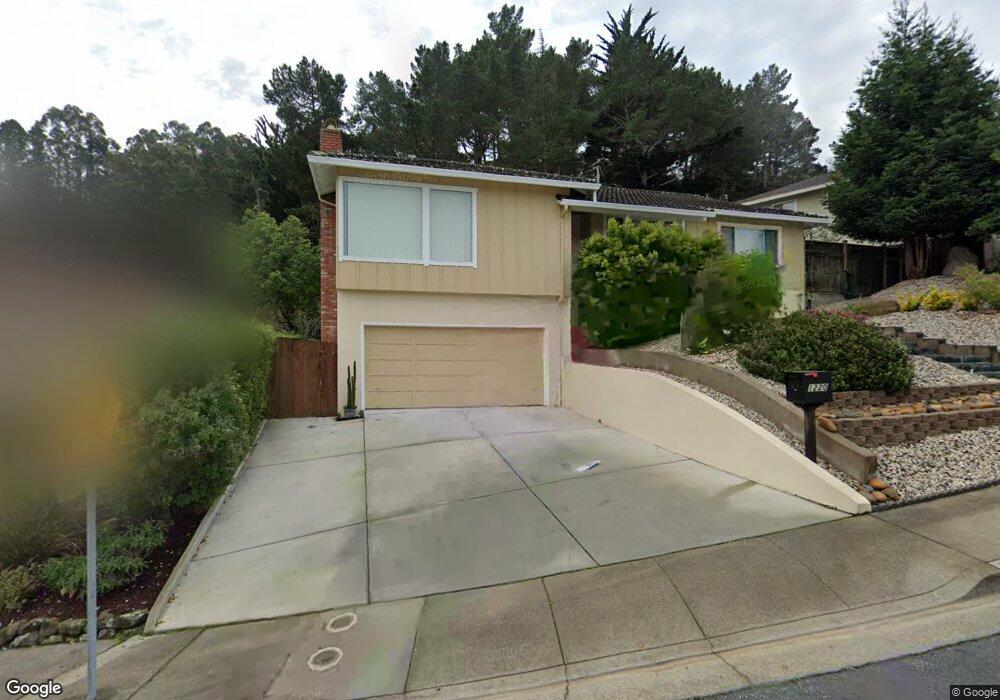
1220 Tuolumne Rd Millbrae, CA 94030
Estimated Value: $2,327,000 - $2,975,000
4
Beds
4
Baths
2,360
Sq Ft
$1,115/Sq Ft
Est. Value
About This Home
This home is located at 1220 Tuolumne Rd, Millbrae, CA 94030 and is currently estimated at $2,631,933, approximately $1,115 per square foot. 1220 Tuolumne Rd is a home located in San Mateo County with nearby schools including Meadows Elementary School, Taylor Middle School, and Mills High School.
Ownership History
Date
Name
Owned For
Owner Type
Purchase Details
Closed on
Jul 29, 2023
Sold by
Leung Curtis Park and Leung Emily Po-Yuk
Bought by
Leung Family Trust and Leung
Current Estimated Value
Purchase Details
Closed on
Dec 29, 2011
Sold by
Wong Paddy and Wong Janice
Bought by
Leung Curtis Park and Leung Emily Po Yuk
Home Financials for this Owner
Home Financials are based on the most recent Mortgage that was taken out on this home.
Original Mortgage
$625,000
Interest Rate
3.91%
Mortgage Type
New Conventional
Purchase Details
Closed on
Feb 3, 2007
Sold by
Wong Paddy and Wong Janice
Bought by
Wong Paddy and Wong Janice
Purchase Details
Closed on
May 10, 1999
Sold by
Lansing Joseph J and Lansing Christine Y
Bought by
Wong Paddy and Wong Janice Kai Li
Home Financials for this Owner
Home Financials are based on the most recent Mortgage that was taken out on this home.
Original Mortgage
$512,000
Interest Rate
6.87%
Create a Home Valuation Report for This Property
The Home Valuation Report is an in-depth analysis detailing your home's value as well as a comparison with similar homes in the area
Home Values in the Area
Average Home Value in this Area
Purchase History
| Date | Buyer | Sale Price | Title Company |
|---|---|---|---|
| Leung Family Trust | -- | None Listed On Document | |
| Leung Curtis Park | $1,128,000 | Old Republic Title Company | |
| Wong Paddy | -- | None Available | |
| Wong Paddy | $640,000 | Old Republic Title Ins Compa |
Source: Public Records
Mortgage History
| Date | Status | Borrower | Loan Amount |
|---|---|---|---|
| Previous Owner | Leung Curtis Park | $625,000 | |
| Previous Owner | Wong Paddy | $512,000 |
Source: Public Records
Tax History Compared to Growth
Tax History
| Year | Tax Paid | Tax Assessment Tax Assessment Total Assessment is a certain percentage of the fair market value that is determined by local assessors to be the total taxable value of land and additions on the property. | Land | Improvement |
|---|---|---|---|---|
| 2025 | $16,888 | $1,416,822 | $708,411 | $708,411 |
| 2023 | $16,888 | $1,361,806 | $680,903 | $680,903 |
| 2022 | $15,084 | $1,335,104 | $667,552 | $667,552 |
| 2021 | $14,913 | $1,308,926 | $654,463 | $654,463 |
| 2020 | $14,668 | $1,295,506 | $647,753 | $647,753 |
| 2019 | $14,318 | $1,270,104 | $635,052 | $635,052 |
| 2018 | $14,035 | $1,245,200 | $622,600 | $622,600 |
| 2017 | $13,730 | $1,220,786 | $610,393 | $610,393 |
| 2016 | $13,554 | $1,196,850 | $598,425 | $598,425 |
| 2015 | $13,460 | $1,178,874 | $589,437 | $589,437 |
| 2014 | $13,152 | $1,155,782 | $577,891 | $577,891 |
Source: Public Records
Map
Nearby Homes
- 842 Clearfield Dr
- 818 Crestview Dr
- 1297 Vista Grande
- 43 Aura Vista
- 150 El Bonito Way
- 15 Mullins Ct
- 450 Laurel Ave
- 555 Palm Ave Unit 207
- 8 Millbrae Cir
- 1385 Terrace Dr
- 815 Lomita Ave
- 211 Anita Dr
- 90 Conejo Dr
- 443 Lomita Ave
- 360 Vallejo Dr Unit 116
- 360 Vallejo Dr Unit 105
- 360 Vallejo Dr Unit 97
- 320 Vallejo Dr Unit 47
- 340 Vallejo Dr Unit 50
- 340 Vallejo Dr Unit 80
- 1230 Tuolumne Rd
- 1210 Tuolumne Rd
- 1240 Tuolumne Rd
- 1200 Tuolumne Rd
- 1196 Tuolumne Ct
- 1250 Tuolumne Rd
- 1205 Tuolumne Rd
- 1201 Tuolumne Rd
- 1215 Tuolumne Rd
- 1225 Tuolumne Rd
- 1195 Tuolumne Rd
- 1190 Tuolumne Ct
- 1235 Tuolumne Rd
- 1260 Tuolumne Rd
- 1239 Tuolumne Rd
- 1170 Tuolumne Ct
- 1186 Tuolumne Rd
- 1270 Tuolumne Rd
- 1175 Tuolumne Rd
- 1245 Tuolumne Rd