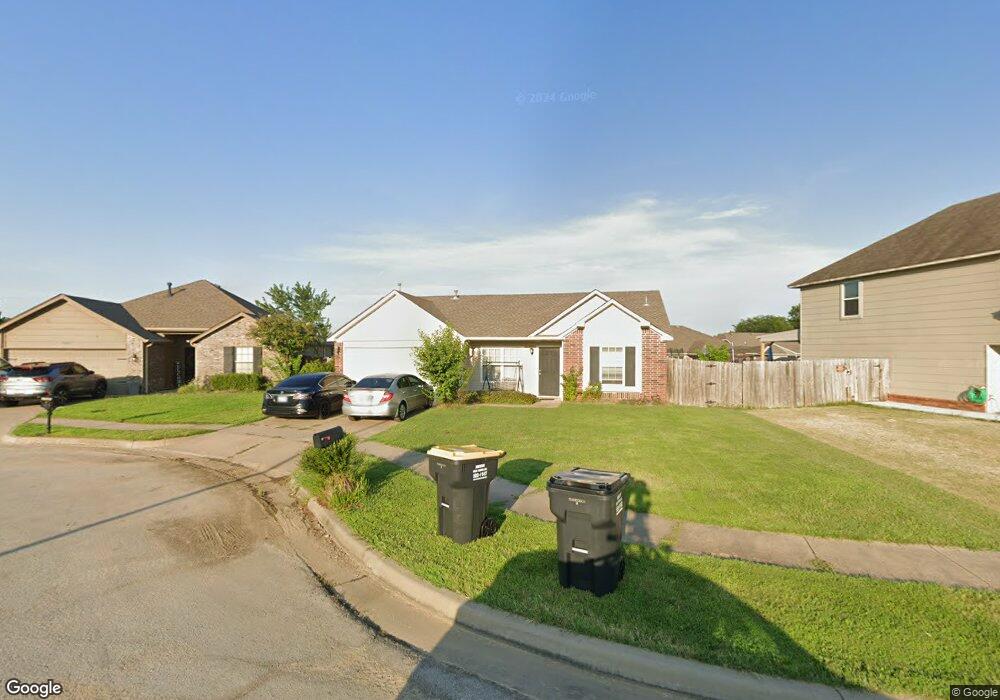
12201 S 269th East Ave Coweta, OK 74429
Estimated Value: $186,661 - $217,000
3
Beds
2
Baths
1,094
Sq Ft
$183/Sq Ft
Est. Value
About This Home
This home is located at 12201 S 269th East Ave, Coweta, OK 74429 and is currently estimated at $199,665, approximately $182 per square foot. 12201 S 269th East Ave is a home located in Wagoner County with nearby schools including Donald P. Sloat Junior High School, Coweta Intermediate High School, and Coweta High School.
Ownership History
Date
Name
Owned For
Owner Type
Purchase Details
Closed on
Jun 15, 2017
Sold by
Harris Kaleb and Harris Sarah
Bought by
Vanvannguyen Thuy Van and Pham Linh My
Current Estimated Value
Purchase Details
Closed on
Mar 14, 2011
Sold by
Ellis Douglas D and Ellis Tamara L
Bought by
Harris Kaleb and Harris Sarah
Home Financials for this Owner
Home Financials are based on the most recent Mortgage that was taken out on this home.
Original Mortgage
$115,016
Interest Rate
4.78%
Mortgage Type
FHA
Purchase Details
Closed on
Oct 18, 2006
Sold by
Rausch Coleman Homes Of Tulsa Llc
Bought by
Ellis Douglas D
Home Financials for this Owner
Home Financials are based on the most recent Mortgage that was taken out on this home.
Original Mortgage
$83,520
Interest Rate
6.46%
Mortgage Type
New Conventional
Create a Home Valuation Report for This Property
The Home Valuation Report is an in-depth analysis detailing your home's value as well as a comparison with similar homes in the area
Home Values in the Area
Average Home Value in this Area
Purchase History
| Date | Buyer | Sale Price | Title Company |
|---|---|---|---|
| Vanvannguyen Thuy Van | $110,000 | First Title And Abstract | |
| Harris Kaleb | $116,500 | Executives Title & Escrow Co | |
| Ellis Douglas D | $104,500 | Beacon Title Company |
Source: Public Records
Mortgage History
| Date | Status | Borrower | Loan Amount |
|---|---|---|---|
| Previous Owner | Harris Kaleb | $115,016 | |
| Previous Owner | Ellis Douglas D | $83,520 |
Source: Public Records
Tax History Compared to Growth
Tax History
| Year | Tax Paid | Tax Assessment Tax Assessment Total Assessment is a certain percentage of the fair market value that is determined by local assessors to be the total taxable value of land and additions on the property. | Land | Improvement |
|---|---|---|---|---|
| 2025 | $1,230 | $14,426 | $2,643 | $11,783 |
| 2024 | $1,230 | $14,006 | $2,566 | $11,440 |
| 2023 | $1,192 | $13,598 | $2,523 | $11,075 |
| 2022 | $1,144 | $13,202 | $2,468 | $10,734 |
| 2021 | $1,131 | $12,817 | $2,453 | $10,364 |
| 2020 | $1,064 | $12,444 | $2,453 | $9,991 |
| 2019 | $1,050 | $12,082 | $2,453 | $9,629 |
| 2018 | $1,072 | $12,082 | $2,453 | $9,629 |
| 2017 | $1,163 | $12,256 | $2,453 | $9,803 |
| 2016 | $1,110 | $11,672 | $2,453 | $9,219 |
| 2015 | $1,161 | $11,672 | $2,453 | $9,219 |
| 2014 | $1,280 | $12,974 | $2,016 | $10,958 |
Source: Public Records
Map
Nearby Homes
- 07 S 271st East Ave
- 27089 E 123rd St S
- 12272 S 268th East Ave
- 12159 S 271st Ave E
- 27107 E 123rd St S
- 10876 S 271st East Ave
- 10897 S 271st East Ave
- 10877 S 271st East Ave
- 10930 S 271st East Ave
- 10920 S 271st East Ave
- 05 S 272nd Ave
- 1 S 272nd Ave
- 2 Oklahoma 51
- 1 Oklahoma 51
- 5 E Highway 51
- 11923 S 267th East Ave
- 11907 S 266th East Ave
- 11822 S 268th East Ave
- 27860 E 118th Place S
- 27861 E 118th Place S
- 12219 S 269th Ave E
- 12219 S 269th East Ave
- 26955 E 122nd St
- 12206 S 270th East Ave
- 12235 S 269th East Ave
- 12214 S 270th Ave E
- 12214 S 270th East Ave
- 26945 E 122nd St
- 12200 S 270th East Ave
- 26910 E 122nd St
- 26931 E 122nd St
- 12247 S 269th Ave E
- 12247 S 269th East Ave
- 12228 S 270th East Ave
- 26919 E 122nd Place
- 26909 E 122nd St
- 26890 E 122nd St
- 12183 S 270th East Ave
- 26891 E 122nd Place
- 26889 E 122nd St