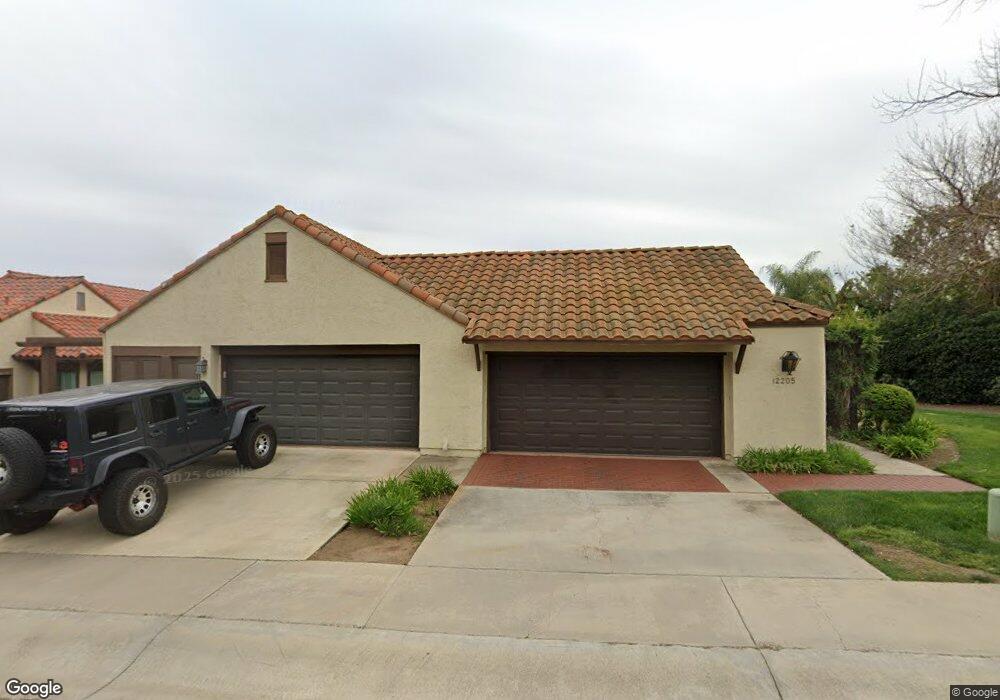
12205 Bajada Rd Unit 57 San Diego, CA 92128
Rancho Bernardo NeighborhoodEstimated Value: $801,452 - $915,000
2
Beds
2
Baths
1,404
Sq Ft
$599/Sq Ft
Est. Value
About This Home
This home is located at 12205 Bajada Rd Unit 57, San Diego, CA 92128 and is currently estimated at $841,113, approximately $599 per square foot. 12205 Bajada Rd Unit 57 is a home located in San Diego County with nearby schools including Chaparral Elementary, Bernardo Heights Middle, and Rancho Bernardo High.
Ownership History
Date
Name
Owned For
Owner Type
Purchase Details
Closed on
Nov 6, 2019
Sold by
Boland Linda P
Bought by
Boland Linda P
Current Estimated Value
Purchase Details
Closed on
Mar 30, 2004
Sold by
Boland Eric
Bought by
Boland Linda P
Home Financials for this Owner
Home Financials are based on the most recent Mortgage that was taken out on this home.
Original Mortgage
$340,000
Outstanding Balance
$145,496
Interest Rate
4.37%
Mortgage Type
New Conventional
Estimated Equity
$695,617
Purchase Details
Closed on
Mar 26, 2004
Sold by
Wells Fargo Bank Na
Bought by
Boland Linda P
Home Financials for this Owner
Home Financials are based on the most recent Mortgage that was taken out on this home.
Original Mortgage
$340,000
Outstanding Balance
$145,496
Interest Rate
4.37%
Mortgage Type
New Conventional
Estimated Equity
$695,617
Purchase Details
Closed on
Dec 7, 1992
Sold by
Gardner George J and Gardner Jacquelyn P
Bought by
Gardner George J
Purchase Details
Closed on
Jan 6, 1984
Create a Home Valuation Report for This Property
The Home Valuation Report is an in-depth analysis detailing your home's value as well as a comparison with similar homes in the area
Home Values in the Area
Average Home Value in this Area
Purchase History
| Date | Buyer | Sale Price | Title Company |
|---|---|---|---|
| Boland Linda P | -- | None Available | |
| Boland Linda P | -- | Commonwealth Land Title Co | |
| Boland Linda P | $460,000 | Commonwealth Land Title Co | |
| Gardner George J | -- | Stewart Title Of Ca Inc | |
| -- | $190,000 | -- |
Source: Public Records
Mortgage History
| Date | Status | Borrower | Loan Amount |
|---|---|---|---|
| Open | Boland Linda P | $340,000 |
Source: Public Records
Tax History Compared to Growth
Tax History
| Year | Tax Paid | Tax Assessment Tax Assessment Total Assessment is a certain percentage of the fair market value that is determined by local assessors to be the total taxable value of land and additions on the property. | Land | Improvement |
|---|---|---|---|---|
| 2025 | $7,185 | $653,991 | $454,952 | $199,039 |
| 2024 | $7,185 | $641,169 | $446,032 | $195,137 |
| 2023 | $7,031 | $628,598 | $437,287 | $191,311 |
| 2022 | $6,913 | $616,273 | $428,713 | $187,560 |
| 2021 | $6,822 | $604,190 | $420,307 | $183,883 |
| 2020 | $6,729 | $597,996 | $415,998 | $181,998 |
| 2019 | $6,553 | $586,272 | $407,842 | $178,430 |
| 2018 | $6,367 | $574,778 | $399,846 | $174,932 |
| 2017 | $6,196 | $563,508 | $392,006 | $171,502 |
| 2016 | $5,489 | $500,000 | $232,000 | $268,000 |
| 2015 | $5,048 | $460,000 | $214,000 | $246,000 |
| 2014 | $4,587 | $420,000 | $196,000 | $224,000 |
Source: Public Records
Map
Nearby Homes
- 11915 Fairhope Rd
- 12031 Caminito Cadena
- 11864 Bernardo Terrace Unit C
- 11872 Bernardo Terrace Unit E
- 17438 Ashburton Rd
- 11984 Rancho Bernardo Rd Unit J
- 17071 Bernardo Center Dr Unit A
- 12093 Caminito Campana
- 12094 Caminito Campana
- 11825 Caminito Ronaldo Unit 119
- 11820 Caminito Ronaldo Unit 222
- 17925 Caminito Pinero Unit 270
- 17885 Caminito Pinero Unit 255
- 17147 W Bernardo Dr Unit 103
- 17141 W Bernardo Dr Unit 204
- 17159 W Bernardo Dr Unit 202
- 17081 W Bernardo Dr Unit 203
- 17141 W Bernardo Dr Unit 203
- 17129 W Bernardo Dr Unit 208
- 17093 W Bernardo Dr Unit 205
- 12211 Bajada Rd
- 12217 Bajada Rd
- 12195 Bajada Rd
- 12223 Bajada Rd
- 12229 Bajada Rd
- 12187 Bajada Rd
- 12235 Bajada Rd Unit 62
- 17423 Carnton Way Unit 44
- 17423 Graciosa Rd
- 17393 Graciosa Ct
- 17429 Carnton Way
- 12241 Bajada Rd
- 12179 Bajada Rd
- 17435 Carnton Way
- 12247 Bajada Rd
- 12171 Bajada Rd
- 17353 Graciosa Ct
- 17447 Carnton Way
- 12277 Bajada Rd
- 12259 Bajada Rd