X
Seller's Agent in 2025
Xiao Yee
Century 21 Excellence Realty
(614) 266-0760
1 in this area
17 Total Sales
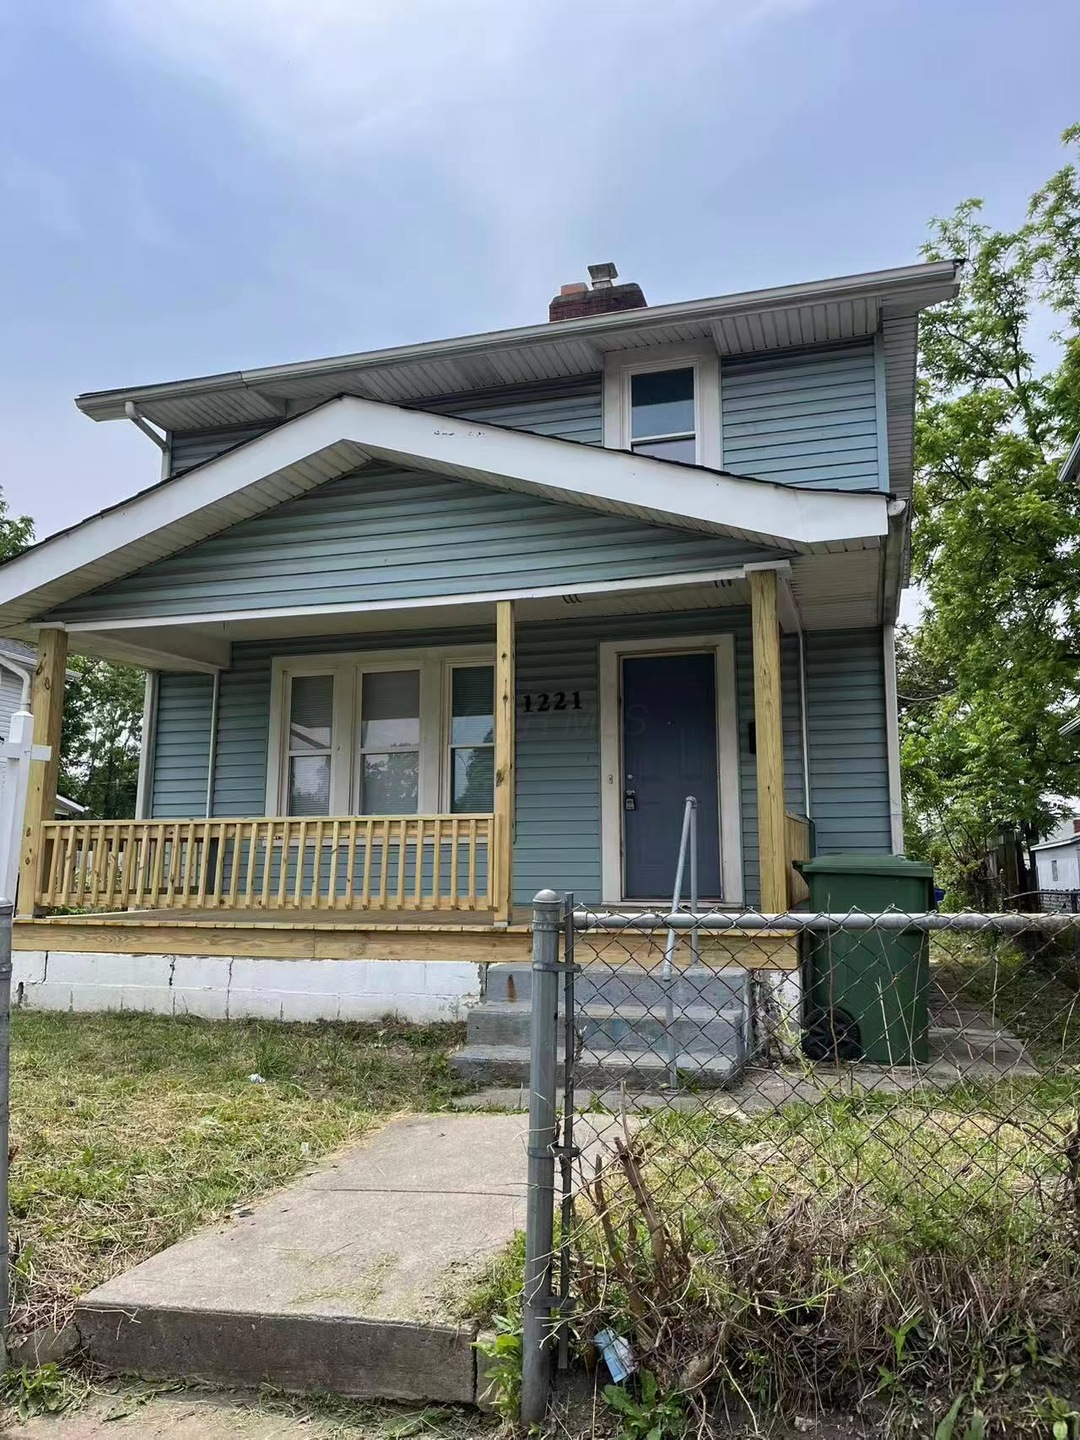
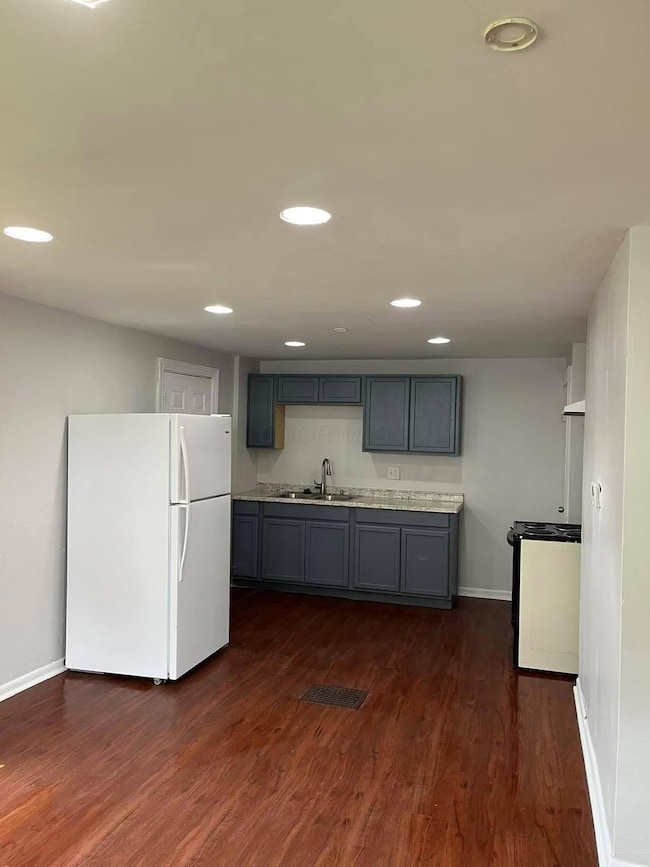
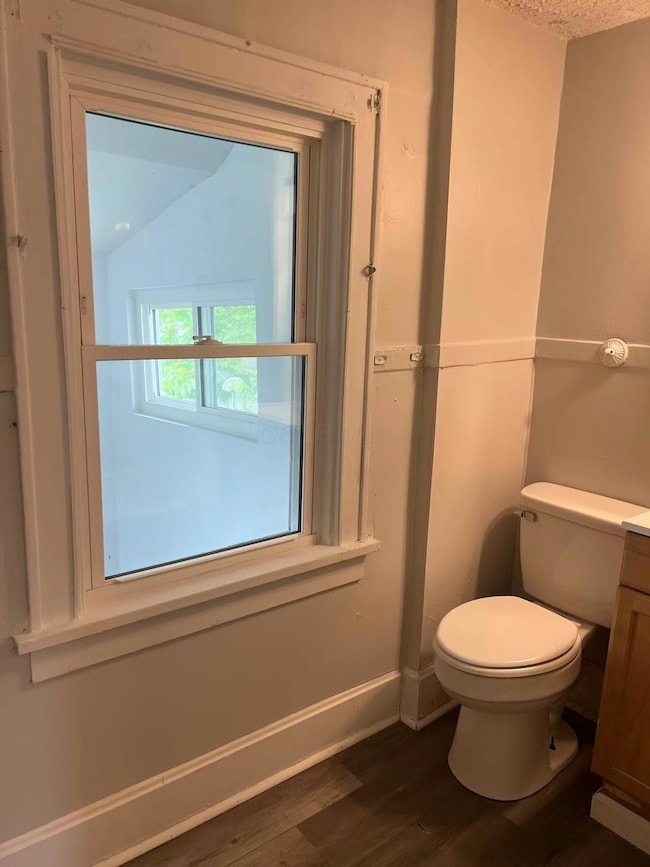
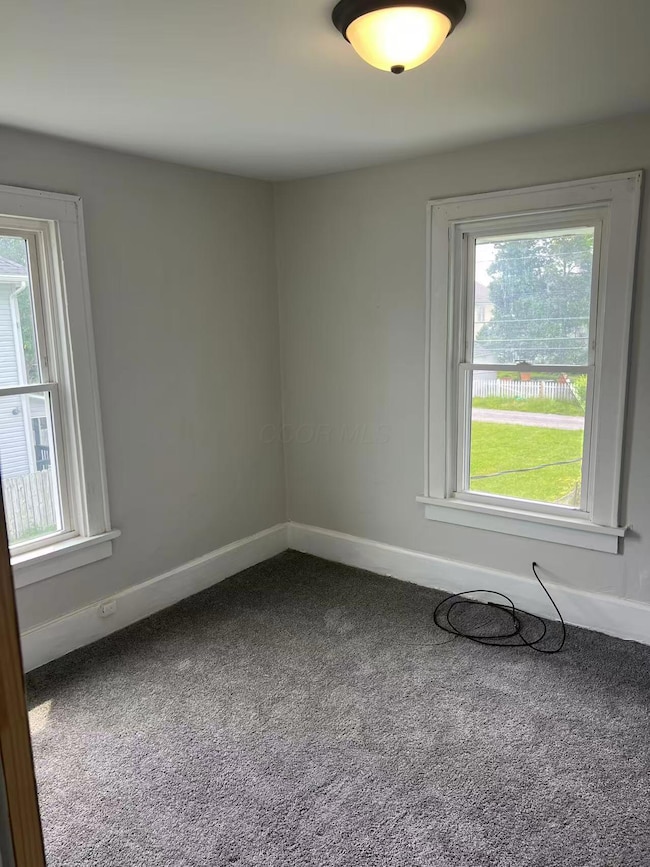
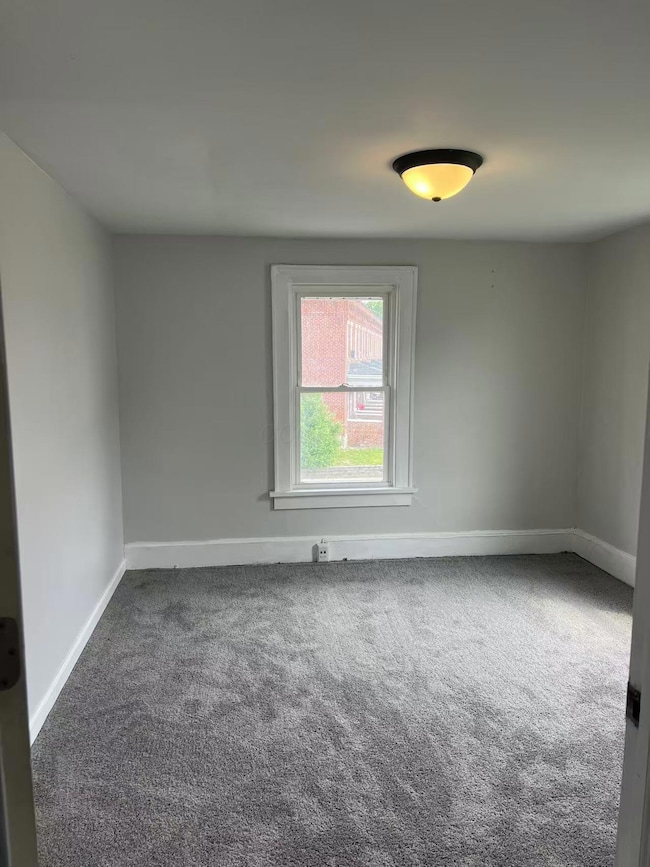
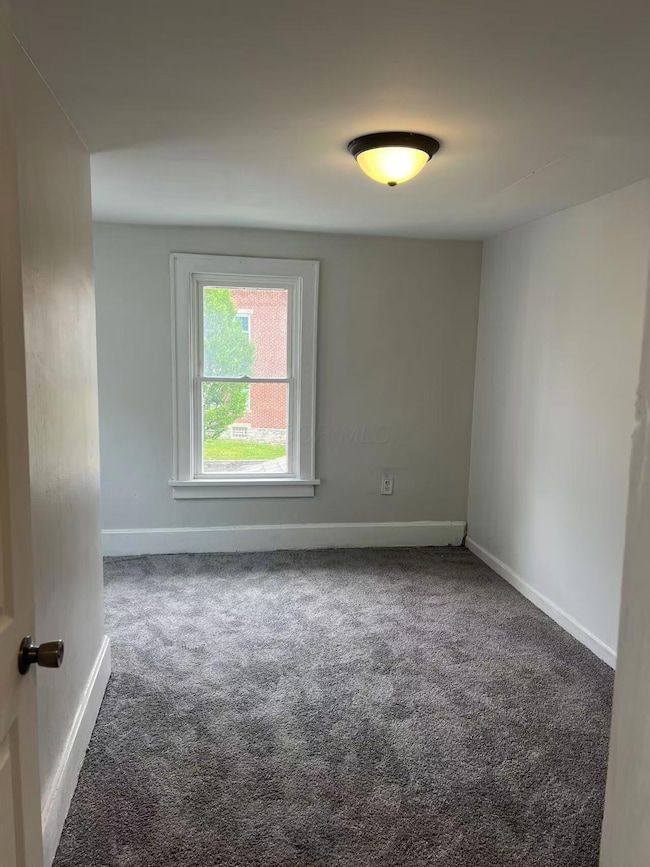
This well-maintained 3-bedroom, 1-bathroom home has been freshly painted and features brand-new carpet in all bedrooms. Recent updates include a new furnace (2024), recessed lighting in the kitchen, and all-new windows (2024), ensuring comfort and energy efficiency. Enjoy the outdoors on the newly built deck (2025), perfect for relaxing or entertaining.
Conveniently located with easy access to shopping, dining, schools, and major routes?this home is close to everything you need. Whether you?re looking for a cozy place to call home or a smart investment property, this move-in-ready gem is a fantastic choice! The seller prefers to sell as -is !
Last Agent to Sell the Property
Century 21 Excellence Realty License #2022005135 Listed on: 06/05/2025

| Date | Type | Sale Price | Title Company |
|---|---|---|---|
| Warranty Deed | $136,000 | Win Title | |
| Warranty Deed | $76,000 | World Class Title | |
| Warranty Deed | $50,000 | World Class Title Agency Of | |
| Warranty Deed | $25,000 | World Class Title Agency Of | |
| Quit Claim Deed | $14,500 | Attorney | |
| Warranty Deed | $10,000 | Tlc Title | |
| Limited Warranty Deed | $7,100 | Attorney | |
| Sheriffs Deed | $28,000 | None Available | |
| Deed | -- | -- |
| Date | Status | Loan Amount | Loan Type |
|---|---|---|---|
| Open | $142,000 | Credit Line Revolving |
| Date | Event | Price | Change | Sq Ft Price |
|---|---|---|---|---|
| 08/18/2025 08/18/25 | Sold | $136,000 | -12.0% | $126 / Sq Ft |
| 07/07/2025 07/07/25 | Pending | -- | -- | -- |
| 07/02/2025 07/02/25 | Price Changed | $154,500 | -0.3% | $143 / Sq Ft |
| 06/05/2025 06/05/25 | For Sale | $154,900 | -- | $143 / Sq Ft |
| Year | Tax Paid | Tax Assessment Tax Assessment Total Assessment is a certain percentage of the fair market value that is determined by local assessors to be the total taxable value of land and additions on the property. | Land | Improvement |
|---|---|---|---|---|
| 2024 | $2,219 | $48,410 | $19,390 | $29,020 |
| 2023 | $2,191 | $48,405 | $19,390 | $29,015 |
| 2022 | $940 | $17,680 | $1,370 | $16,310 |
| 2021 | $941 | $17,680 | $1,370 | $16,310 |
| 2020 | $1,093 | $17,680 | $1,370 | $16,310 |
| 2019 | $1,144 | $14,700 | $1,120 | $13,580 |
| 2018 | $769 | $14,700 | $1,120 | $13,580 |
| 2017 | $966 | $14,700 | $1,120 | $13,580 |
| 2016 | $738 | $10,120 | $2,240 | $7,880 |
| 2015 | $626 | $10,120 | $2,240 | $7,880 |
| 2014 | $627 | $10,120 | $2,240 | $7,880 |
| 2013 | $326 | $10,640 | $2,345 | $8,295 |
X
Seller's Agent in 2025
Xiao Yee
Century 21 Excellence Realty
(614) 266-0760
1 in this area
17 Total Sales
D
Seller Co-Listing Agent in 2025
Dongliang Huang
Century 21 Excellence Realty
(614) 633-5458
1 in this area
9 Total Sales
T
Buyer's Agent in 2025
Tarry Summers
Red 1 Realty
(614) 226-3329
1 in this area
4 Total Sales
Source: Columbus and Central Ohio Regional MLS
MLS Number: 225020003
APN: 010-021632
Disclaimer: Certain information contained herein is derived from information provided by parties other than Homes.com. All information provided is deemed reliable, but is not guaranteed to be accurate and should be independently verified.
![]() IDX information is provided exclusively for personal, non-commercial use, and may not be used for any purpose other than to identify prospective properties consumers may be interested in purchasing.
IDX information is provided exclusively for personal, non-commercial use, and may not be used for any purpose other than to identify prospective properties consumers may be interested in purchasing.
Information is deemed reliable but not guaranteed.