Estimated Value: $301,000 - $328,000
3
Beds
2
Baths
1,753
Sq Ft
$181/Sq Ft
Est. Value
About This Home
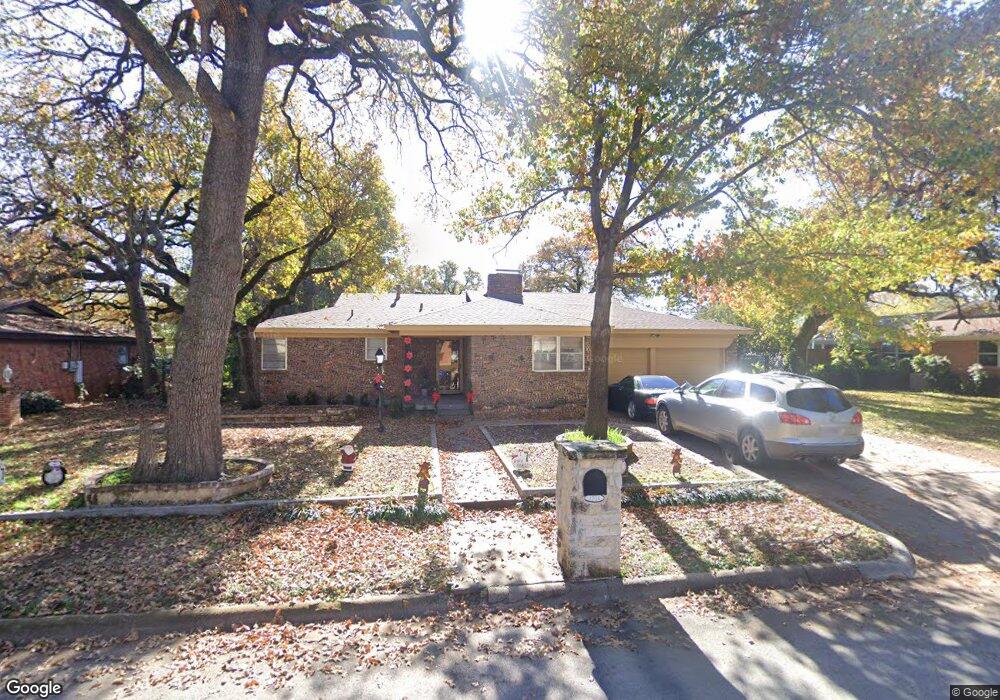
This home is located at 1221 Crestview Dr, Hurst, TX 76053 and is currently estimated at $316,686, approximately $180 per square foot. 1221 Crestview Dr is a home located in Tarrant County with nearby schools including Hurst Hills Elementary School, Hurst J High School, and L.D. Bell High School.
Ownership History
Date
Name
Owned For
Owner Type
Purchase Details
Closed on
Nov 4, 2020
Sold by
Poudel Dal B and Poudel Dilli M
Bought by
Adams Cortney
Current Estimated Value
Home Financials for this Owner
Home Financials are based on the most recent Mortgage that was taken out on this home.
Original Mortgage
$7,069
Outstanding Balance
$6,288
Interest Rate
2.78%
Mortgage Type
New Conventional
Estimated Equity
$310,398
Purchase Details
Closed on
Sep 21, 2015
Sold by
Mccown Shelly Ward and Mccown Shannon
Bought by
Poudel Dal B
Home Financials for this Owner
Home Financials are based on the most recent Mortgage that was taken out on this home.
Original Mortgage
$94,627
Interest Rate
4.37%
Mortgage Type
FHA
Purchase Details
Closed on
Feb 6, 2014
Sold by
Estate Of Eva Lanell Ward
Bought by
Burgess Teresa
Create a Home Valuation Report for This Property
The Home Valuation Report is an in-depth analysis detailing your home's value as well as a comparison with similar homes in the area
Home Values in the Area
Average Home Value in this Area
Purchase History
| Date | Buyer | Sale Price | Title Company |
|---|---|---|---|
| Adams Cortney | -- | Dhi Title Fort Worth | |
| Poudel Dal B | -- | Rtt | |
| Burgess Teresa | -- | None Available |
Source: Public Records
Mortgage History
| Date | Status | Borrower | Loan Amount |
|---|---|---|---|
| Open | Adams Cortney | $7,069 | |
| Open | Adams Cortney | $235,653 | |
| Previous Owner | Poudel Dal B | $94,627 |
Source: Public Records
Tax History Compared to Growth
Tax History
| Year | Tax Paid | Tax Assessment Tax Assessment Total Assessment is a certain percentage of the fair market value that is determined by local assessors to be the total taxable value of land and additions on the property. | Land | Improvement |
|---|---|---|---|---|
| 2025 | $3,468 | $242,734 | $65,400 | $177,334 |
| 2024 | $3,468 | $242,734 | $65,400 | $177,334 |
| 2023 | $4,796 | $239,415 | $54,320 | $185,095 |
| 2022 | $5,353 | $235,479 | $54,355 | $181,124 |
| 2021 | $5,097 | $211,339 | $50,000 | $161,339 |
| 2020 | $4,555 | $189,313 | $50,000 | $139,313 |
| 2019 | $4,396 | $189,000 | $50,000 | $139,000 |
| 2018 | $3,425 | $163,284 | $20,000 | $143,284 |
| 2017 | $3,756 | $162,047 | $20,000 | $142,047 |
| 2016 | $3,415 | $134,945 | $20,000 | $114,945 |
| 2015 | $2,363 | $97,600 | $20,000 | $77,600 |
| 2014 | $2,363 | $97,600 | $20,000 | $77,600 |
Source: Public Records
Map
Nearby Homes
- 1200 Walker Dr
- 1112 Blakey Ct
- 228 Arcadia St
- 8308 Fall Crest Dr
- 8105 Winter Falls Trail
- 8129 Trinity Vista Trail
- 405 Billy Creek Cir
- 1304 W Redbud Dr
- 1361 Kathryn Ct
- 3216 Fountain Pkwy
- 8216 Snow Goose Way
- 512 Billie Ruth Ln
- 632 Melbourne Ct
- 821 Cullum Ct
- 425 Moore Creek Rd
- 8528 Mystic Trail
- 8736 Trinity Vista Trail
- 649 Timberline Dr
- 2954 Volga Ct
- 2967 Danube Ct
- 1225 Crestview Dr
- 1217 Crestview Dr
- 1213 Crestview Dr
- 1220 Crestview Dr
- 1216 Crestview Dr
- 1224 Crestview Dr
- 1233 Crestview Dr
- 1212 Crestview Dr
- 1209 Crestview Dr
- 200 Fanning Dr
- 1208 Crestview Dr
- 1205 Crestview Dr
- 1205 Crestview Dr
- 1237 Crestview Dr
- 1221 Bradford Dr
- 204 Fanning Dr
- 1217 Bradford Dr
- 1225 Bradford Dr
- 1213 Bradford Dr
- 1228 W Hurst Blvd