Estimated Value: $213,000 - $271,000
--
Bed
3
Baths
1,728
Sq Ft
$143/Sq Ft
Est. Value
About This Home
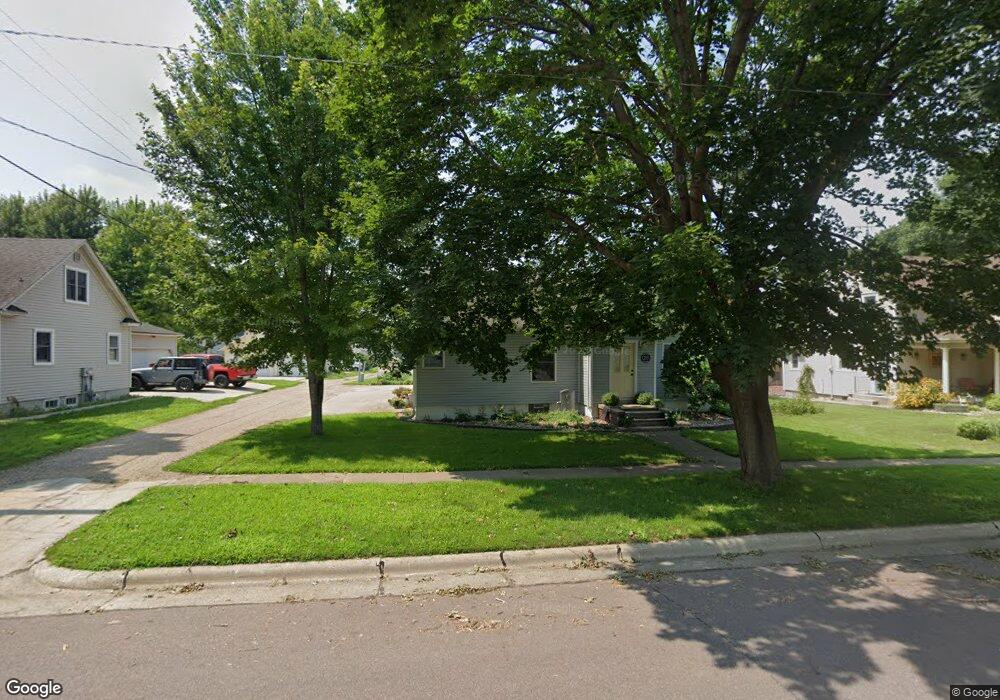
This home is located at 1221 Elm St, Hull, IA 51239 and is currently estimated at $247,213, approximately $143 per square foot. 1221 Elm St is a home located in Sioux County with nearby schools including Boyden-Hull Elementary School, Boyden-Hull High School, and Hull Christian School.
Ownership History
Date
Name
Owned For
Owner Type
Purchase Details
Closed on
Mar 4, 2025
Sold by
Vanravenswaay Lyle and Vanravenswaay Mary S
Bought by
Vanravenswaay Jon Michael
Current Estimated Value
Create a Home Valuation Report for This Property
The Home Valuation Report is an in-depth analysis detailing your home's value as well as a comparison with similar homes in the area
Home Values in the Area
Average Home Value in this Area
Purchase History
| Date | Buyer | Sale Price | Title Company |
|---|---|---|---|
| Vanravenswaay Jon Michael | $258,000 | None Listed On Document | |
| Vanravenswaay Jon Michael | $258,000 | None Listed On Document |
Source: Public Records
Tax History Compared to Growth
Tax History
| Year | Tax Paid | Tax Assessment Tax Assessment Total Assessment is a certain percentage of the fair market value that is determined by local assessors to be the total taxable value of land and additions on the property. | Land | Improvement |
|---|---|---|---|---|
| 2025 | $2,320 | $197,930 | $20,910 | $177,020 |
| 2024 | $2,320 | $163,070 | $20,910 | $142,160 |
| 2023 | $2,284 | $163,070 | $20,910 | $142,160 |
| 2022 | $2,082 | $130,110 | $20,910 | $109,200 |
| 2021 | $1,986 | $129,500 | $20,910 | $108,590 |
| 2020 | $1,986 | $117,870 | $20,910 | $96,960 |
| 2019 | $1,572 | $93,930 | $8,710 | $85,220 |
| 2018 | $1,600 | $93,930 | $8,710 | $85,220 |
| 2017 | $1,600 | $93,930 | $8,710 | $85,220 |
| 2014 | $1,260 | $76,560 | $0 | $0 |
Source: Public Records
Map
Nearby Homes