1221 Grant Ct Fairfield, CA 94533
Estimated Value: $467,000 - $513,047
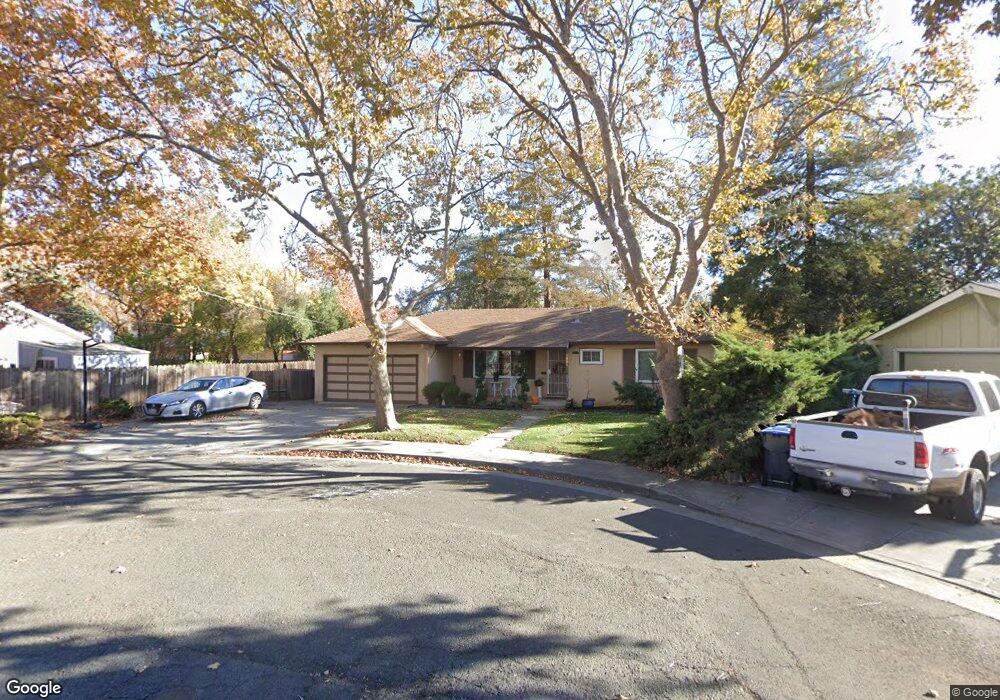
About This Home
This home is located at 1221 Grant Ct, Fairfield, CA 94533 and is currently estimated at $485,762, approximately $292 per square foot. 1221 Grant Ct is a home located in Solano County with nearby schools including Fairview Elementary School, Crystal Middle School, and Armijo High School.
Ownership History
We collect this data history from publicly available records. To have your information removed, we recommend requesting removal directly through your county’s website.
Purchase Details
Home Financials for this Owner
Home Financials are based on the most recent Mortgage that was taken out on this home.Purchase Details
Home Financials for this Owner
Home Financials are based on the most recent Mortgage that was taken out on this home.Purchase Details
Home Values in the Area
Average Home Value in this Area
Purchase History
We collect this data history from publicly available records. To have your information removed, we recommend requesting removal directly through your county’s website.
| Date | Buyer | Sale Price | Title Company |
|---|---|---|---|
| $251,000 | Fidelity Title Company | ||
| $135,000 | North American Title Co | ||
| -- | -- |
Mortgage History
We collect this data history from publicly available records. To have your information removed, we recommend requesting removal directly through your county’s website.
| Date | Status | Borrower | Loan Amount |
|---|---|---|---|
| Open | $247,503 | ||
| Previous Owner | $101,250 | ||
| Closed | $27,000 |
Tax History
We collect this data history from publicly available records. To have your information removed, we recommend requesting removal directly through your county’s website.
| Year | Tax Paid | Tax Assessment Tax Assessment Total Assessment is a certain percentage of the fair market value that is determined by local assessors to be the total taxable value of land and additions on the property. | Land | Improvement |
|---|---|---|---|---|
| 2025 | $3,989 | $363,523 | $86,894 | $276,629 |
| 2024 | $3,989 | $356,396 | $85,191 | $271,205 |
| 2023 | $3,865 | $349,409 | $83,521 | $265,888 |
| 2022 | $3,817 | $342,559 | $81,884 | $260,675 |
| 2021 | $3,778 | $335,843 | $80,279 | $255,564 |
| 2020 | $3,689 | $332,400 | $79,456 | $252,944 |
| 2019 | $3,596 | $325,884 | $77,899 | $247,985 |
| 2018 | $3,711 | $319,495 | $76,372 | $243,123 |
| 2017 | $3,538 | $313,231 | $74,875 | $238,356 |
| 2016 | $3,252 | $285,000 | $62,000 | $223,000 |
| 2015 | $2,630 | $244,000 | $54,000 | $190,000 |
| 2014 | $2,469 | $227,000 | $52,000 | $175,000 |
Map
- 1024 Tyler St
- 1131 1st St
- 1517 Garfield St
- 1500 Harrison St
- 1500 Monroe St
- 712 Maryland St
- 0 Webster St Unit 41120649
- 1201 Missouri St
- 1124 Union Ave
- 1521 Empire St
- 0 Madison St
- 1700 Vermont St
- 1712 Utah St
- 1722 Indiana St
- 1719 Elm St
- 337 Colorado St
- 343 Arizona St
- 1123 Tabor Ave
- 1625 Park Ln Unit 17
- 1625 Park Ln Unit 23
- 1225 Grant Ct
- 1229 Grant Ct
- 1220 Utah St
- 1224 Utah St
- 1216 Utah St
- 1206 Pennsylvania Ave
- 1210 Pennsylvania Ave
- 1233 Grant Ct
- 1212 Utah St
- 1228 Utah St
- 1217 Grant Ct
- 1214 Pennsylvania Ave
- 1213 Grant St
- 1237 Grant Ct
- 1221 Utah St
- 1208 Utah St
- 1218 Pennsylvania Ave
- 1225 Utah St
- 1217 Utah St
- 1209 Grant St
Ask me questions while you tour the home.