Estimated Value: $114,000 - $189,000
3
Beds
1
Bath
1,188
Sq Ft
$131/Sq Ft
Est. Value
About This Home
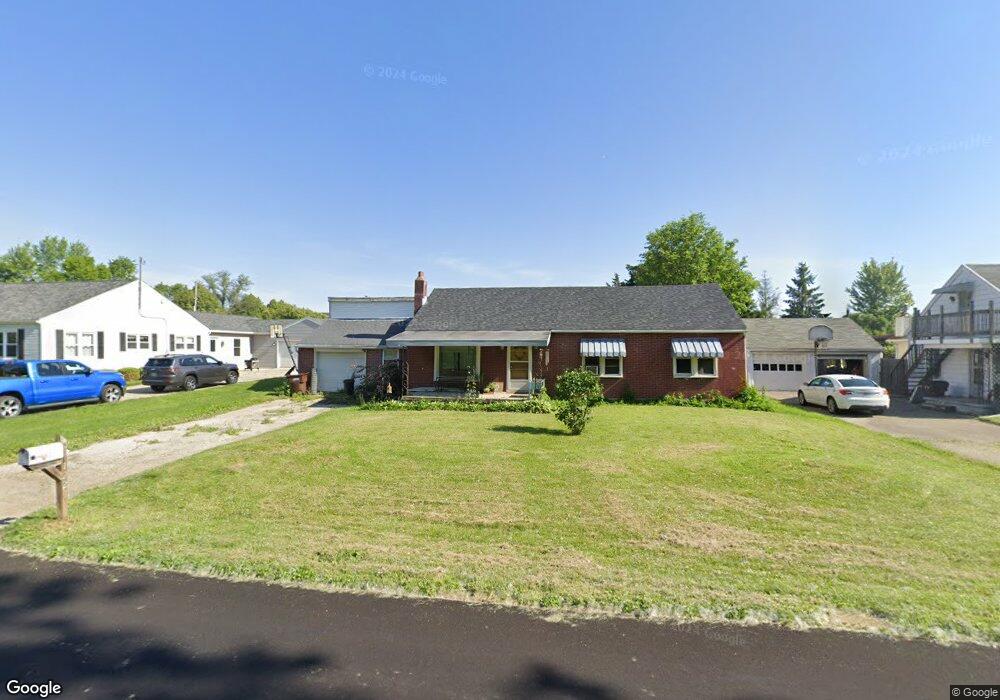
This home is located at 1221 Maple St, Troy, OH 45373 and is currently estimated at $156,037, approximately $131 per square foot. 1221 Maple St is a home located in Miami County with nearby schools including Heywood Elementary School, Van Cleve Elementary School, and Troy Junior High School.
Ownership History
Date
Name
Owned For
Owner Type
Purchase Details
Closed on
Mar 26, 2007
Sold by
Cornick Wanda I and Harris Rajean
Bought by
Harris Rajean D
Current Estimated Value
Purchase Details
Closed on
Jan 4, 2006
Sold by
Fair Robert and Fair Sandra
Bought by
Cornick Wanda I and Harris Rajean
Home Financials for this Owner
Home Financials are based on the most recent Mortgage that was taken out on this home.
Original Mortgage
$50,400
Interest Rate
6.4%
Mortgage Type
New Conventional
Purchase Details
Closed on
Dec 20, 2004
Sold by
Estate Of Audrey M Wesco
Bought by
Fair Robert and Fair Sandra
Purchase Details
Closed on
Sep 1, 1985
Bought by
Wesco Audrey M
Create a Home Valuation Report for This Property
The Home Valuation Report is an in-depth analysis detailing your home's value as well as a comparison with similar homes in the area
Home Values in the Area
Average Home Value in this Area
Purchase History
| Date | Buyer | Sale Price | Title Company |
|---|---|---|---|
| Harris Rajean D | -- | -- | |
| Cornick Wanda I | $63,000 | -- | |
| Fair Robert | $43,000 | -- | |
| Wesco Audrey M | -- | -- |
Source: Public Records
Mortgage History
| Date | Status | Borrower | Loan Amount |
|---|---|---|---|
| Previous Owner | Fair Robert | $50,400 |
Source: Public Records
Tax History Compared to Growth
Tax History
| Year | Tax Paid | Tax Assessment Tax Assessment Total Assessment is a certain percentage of the fair market value that is determined by local assessors to be the total taxable value of land and additions on the property. | Land | Improvement |
|---|---|---|---|---|
| 2024 | $1,380 | $35,460 | $7,320 | $28,140 |
| 2023 | $1,380 | $35,460 | $7,320 | $28,140 |
| 2022 | $1,156 | $35,460 | $7,320 | $28,140 |
| 2021 | $1,026 | $29,540 | $6,090 | $23,450 |
| 2020 | $1,027 | $29,540 | $6,090 | $23,450 |
| 2019 | $1,036 | $29,540 | $6,090 | $23,450 |
| 2018 | $759 | $20,590 | $6,340 | $14,250 |
| 2017 | $766 | $20,590 | $6,340 | $14,250 |
| 2016 | $755 | $20,590 | $6,340 | $14,250 |
| 2015 | $755 | $19,780 | $6,090 | $13,690 |
| 2014 | $755 | $19,780 | $6,090 | $13,690 |
| 2013 | $760 | $19,780 | $6,090 | $13,690 |
Source: Public Records
Map
Nearby Homes