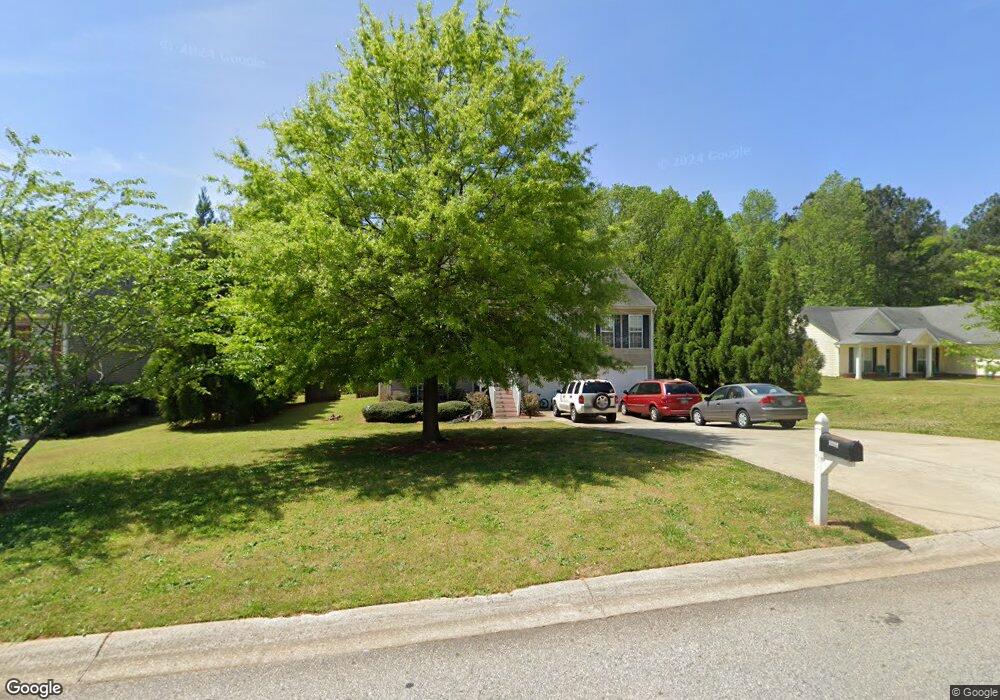
1221 Persimmon Place Dr Unit 44A Bethlehem, GA 30620
Estimated Value: $344,000 - $363,105
3
Beds
2
Baths
2,427
Sq Ft
$146/Sq Ft
Est. Value
About This Home
This home is located at 1221 Persimmon Place Dr Unit 44A, Bethlehem, GA 30620 and is currently estimated at $354,526, approximately $146 per square foot. 1221 Persimmon Place Dr Unit 44A is a home located in Barrow County with nearby schools including Yargo Elementary School, Haymon-Morris Middle School, and Apalachee High School.
Ownership History
Date
Name
Owned For
Owner Type
Purchase Details
Closed on
Jan 29, 2016
Sold by
Watson Christa M
Bought by
Louis Tatiana and Alcy Jesula
Current Estimated Value
Home Financials for this Owner
Home Financials are based on the most recent Mortgage that was taken out on this home.
Original Mortgage
$147,184
Outstanding Balance
$119,380
Interest Rate
4.5%
Mortgage Type
FHA
Estimated Equity
$235,146
Purchase Details
Closed on
Jul 17, 2015
Sold by
Watson Paul
Bought by
Watson Christa
Purchase Details
Closed on
Apr 1, 2004
Sold by
Southfork Hms Inc
Bought by
Watson Paul A and Watson Christa
Home Financials for this Owner
Home Financials are based on the most recent Mortgage that was taken out on this home.
Original Mortgage
$132,385
Interest Rate
5.53%
Mortgage Type
New Conventional
Purchase Details
Closed on
Jan 9, 2004
Sold by
Parkview Development Inc
Bought by
Southfork Homes Inc
Purchase Details
Closed on
May 2, 2000
Bought by
Parkview Development Inc
Create a Home Valuation Report for This Property
The Home Valuation Report is an in-depth analysis detailing your home's value as well as a comparison with similar homes in the area
Home Values in the Area
Average Home Value in this Area
Purchase History
| Date | Buyer | Sale Price | Title Company |
|---|---|---|---|
| Louis Tatiana | $149,900 | -- | |
| Watson Christa | -- | -- | |
| Watson Paul A | $130,400 | -- | |
| Southfork Homes Inc | $750,000 | -- | |
| Parkview Development Inc | -- | -- |
Source: Public Records
Mortgage History
| Date | Status | Borrower | Loan Amount |
|---|---|---|---|
| Open | Louis Tatiana | $147,184 | |
| Previous Owner | Watson Paul A | $132,385 |
Source: Public Records
Tax History Compared to Growth
Tax History
| Year | Tax Paid | Tax Assessment Tax Assessment Total Assessment is a certain percentage of the fair market value that is determined by local assessors to be the total taxable value of land and additions on the property. | Land | Improvement |
|---|---|---|---|---|
| 2024 | $3,216 | $131,032 | $25,200 | $105,832 |
| 2023 | $2,810 | $131,632 | $25,200 | $106,432 |
| 2022 | $2,760 | $97,582 | $20,000 | $77,582 |
| 2021 | $2,566 | $85,884 | $16,000 | $69,884 |
| 2020 | $2,366 | $75,620 | $16,000 | $59,620 |
| 2019 | $2,408 | $75,620 | $16,000 | $59,620 |
| 2018 | $2,299 | $72,820 | $13,200 | $59,620 |
| 2017 | $1,792 | $61,542 | $13,200 | $48,342 |
| 2016 | $1,485 | $46,470 | $13,200 | $33,270 |
| 2015 | $1,503 | $46,837 | $13,200 | $33,637 |
| 2014 | $1,353 | $40,472 | $6,468 | $34,004 |
| 2013 | -- | $38,331 | $6,468 | $31,863 |
Source: Public Records
Map
Nearby Homes
- 0 Jb Owens Unit 7552902
- 0 Jb Owens Unit 7552891
- 0 Jb Owens Unit LOT 2 - 2.09 ACRES
- 0 Jb Owens Unit LOT 3 - 2.01 ACRES
- 637 Sleeping Meadow Ln
- 0 Tanners Bridge Rd Unit 10588144
- 303 Ron Dr
- 763 Moss Side Dr
- 286 Meadows Dr
- 209 Angie Way
- 1129 Loganville Hwy
- 190 Lokeys Ln
- 1071 Covenant Ct
- 103 Camp Ct
- 1111 Otis Dr
- 384 Winslow Ct
- 758 Clarence Edwards Rd
- 1024 Lyndhurst Ln
- 1164 Otis Dr
- 934 Beaver Hill Dr
- 1221 Persimmon Place Dr
- 1223 Persimmon Place Dr Unit 43A
- 1223 Persimmon Place Dr Unit 3
- 1219 Persimmon Place Dr Unit 45A
- 1219 Persimmon Place Dr Unit 3
- 1217 Persimmon Place Dr Unit 46A
- 1217 Persimmon Place Dr Unit 3
- 1225 Persimmon Place Dr
- 1225 Persimmon Pl Dr
- 1215 Persimmon Place Dr Unit 47A
- 1215 Persimmon Place Dr
- 1227 Persimmon Place Dr Unit 41A
- 1227 Persimmon Place Dr Unit 3
- 775 Nature Ct
- 1218 Persimmon Place Dr Unit 16C
- 1218 Persimmon Place Dr Unit 3
- 1220 Persimmon Place Dr Unit 15C
- 1222 Persimmon Place Dr
- 1222 Persimmon Place Dr Unit 3
- 1213 Persimmon Place Dr Unit 48A