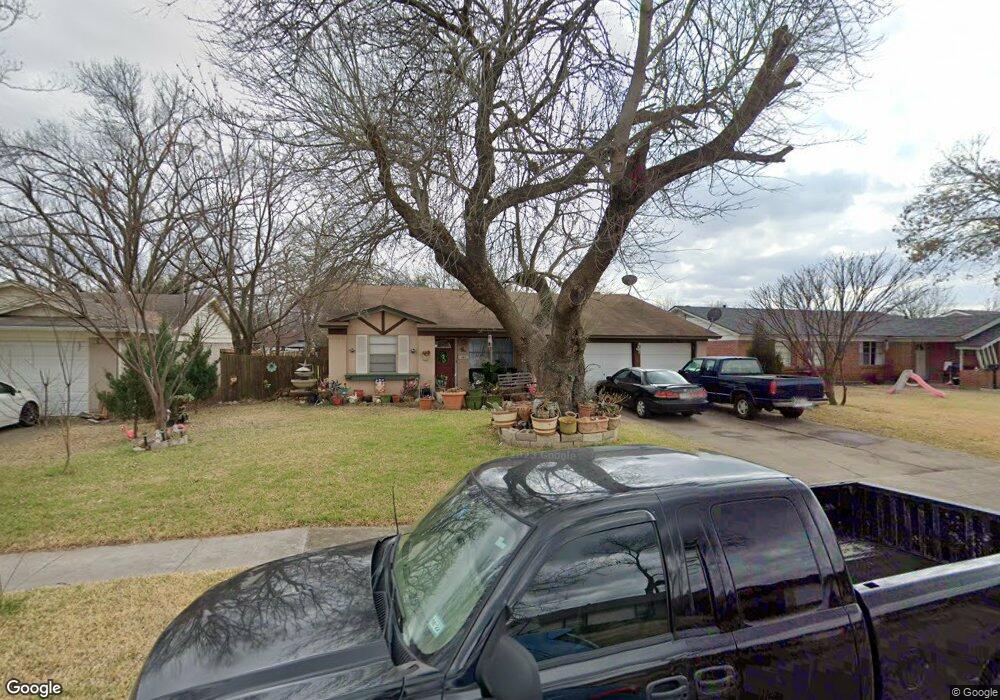
1221 Ridgeway Dr Richardson, TX 75080
Richardson Heights NeighborhoodEstimated Value: $337,000 - $390,000
3
Beds
2
Baths
1,318
Sq Ft
$275/Sq Ft
Est. Value
About This Home
This home is located at 1221 Ridgeway Dr, Richardson, TX 75080 and is currently estimated at $362,049, approximately $274 per square foot. 1221 Ridgeway Dr is a home located in Dallas County with nearby schools including Dover Elementary School, Richardson West Jr. High School, and Richardson High School.
Ownership History
Date
Name
Owned For
Owner Type
Purchase Details
Closed on
Oct 23, 2005
Sold by
Maier Michael John and Maier Jennifer Ann
Bought by
Tudon Luis and Tudon Delfina
Current Estimated Value
Home Financials for this Owner
Home Financials are based on the most recent Mortgage that was taken out on this home.
Original Mortgage
$102,200
Outstanding Balance
$60,700
Interest Rate
7.55%
Mortgage Type
New Conventional
Estimated Equity
$301,349
Purchase Details
Closed on
Jul 17, 2001
Sold by
Gammons Fred D and Gammons Linda
Bought by
Maier Michael John and Maier Jennifer Ann
Home Financials for this Owner
Home Financials are based on the most recent Mortgage that was taken out on this home.
Original Mortgage
$109,600
Interest Rate
7.18%
Purchase Details
Closed on
May 25, 1999
Sold by
Gammons Steven Guy and Keys Kimberly Ann
Bought by
Gammons Fred D
Create a Home Valuation Report for This Property
The Home Valuation Report is an in-depth analysis detailing your home's value as well as a comparison with similar homes in the area
Home Values in the Area
Average Home Value in this Area
Purchase History
| Date | Buyer | Sale Price | Title Company |
|---|---|---|---|
| Tudon Luis | -- | Rtt | |
| Maier Michael John | -- | -- | |
| Gammons Fred D | -- | -- |
Source: Public Records
Mortgage History
| Date | Status | Borrower | Loan Amount |
|---|---|---|---|
| Open | Tudon Luis | $102,200 | |
| Previous Owner | Maier Michael John | $109,600 |
Source: Public Records
Tax History Compared to Growth
Tax History
| Year | Tax Paid | Tax Assessment Tax Assessment Total Assessment is a certain percentage of the fair market value that is determined by local assessors to be the total taxable value of land and additions on the property. | Land | Improvement |
|---|---|---|---|---|
| 2025 | $7,311 | $335,290 | $120,000 | $215,290 |
| 2024 | $7,311 | $335,290 | $120,000 | $215,290 |
| 2023 | $7,311 | $297,180 | $80,000 | $217,180 |
| 2022 | $7,267 | $297,180 | $80,000 | $217,180 |
| 2021 | $6,069 | $231,420 | $80,000 | $151,420 |
| 2020 | $5,571 | $208,660 | $60,000 | $148,660 |
| 2019 | $5,846 | $208,660 | $60,000 | $148,660 |
| 2018 | $4,723 | $176,780 | $55,000 | $121,780 |
| 2017 | $4,479 | $167,740 | $55,000 | $112,740 |
| 2016 | $3,772 | $141,280 | $40,000 | $101,280 |
| 2015 | $3,417 | $138,870 | $40,000 | $98,870 |
| 2014 | $3,417 | $129,470 | $30,000 | $99,470 |
Source: Public Records
Map
Nearby Homes
- 1231 Ridgeway Dr
- 902 Spring Valley Plaza
- 1209 Ridgeway Dr
- 871 Dublin Dr Unit 4
- 857 Dublin Dr Unit 2
- 857 Dublin Dr Unit 3
- 895 Dublin Dr Unit D
- 881 Dublin Dr Unit 2
- 821 Dublin Dr Unit 247
- 821 Dublin Dr Unit 129
- 1200 Ridgeway Dr
- 706 S Waterview Dr
- 1214 Colfax Dr
- 1220 Colfax Cir
- 1112 Ridgeway Cir
- 1122 Parkhaven Dr
- 1220 Dumont Dr
- 1309 Dumont Dr
- 600 S Cottonwood Dr
- 1218 Dalhart Dr
- 1223 Ridgeway Dr
- 1225 Ridgeway Dr
- 1217 Ridgeway Dr
- 1220 Dearborn Dr
- 1218 Dearborn Dr
- 1222 Dearborn Dr
- 1220 Ridgeway Dr
- 1224 Dearborn Dr
- 1216 Dearborn Dr
- 1222 Ridgeway Dr
- 1216 Ridgeway Dr
- 1215 Ridgeway Dr
- 1227 Ridgeway Dr
- 1224 Ridgeway Dr
- 1226 Dearborn Dr
- 1214 Dearborn Dr
- 1214 Ridgeway Dr
- 1213 Ridgeway Dr
- 1229 Ridgeway Dr
- 1226 Ridgeway Dr