
Seller's Agent in 2023
Thrive Real Estate KC Team
KW KANSAS CITY METRO
(913) 825-7720
2 in this area
1,057 Total Sales
Estimated Value: $289,000 - $376,242
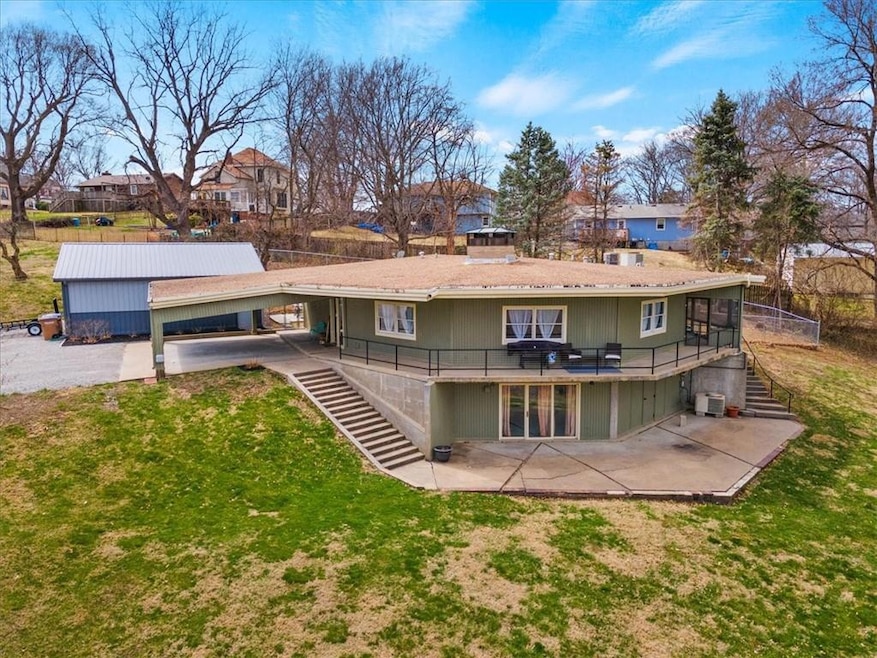
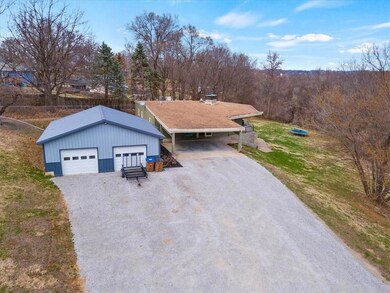
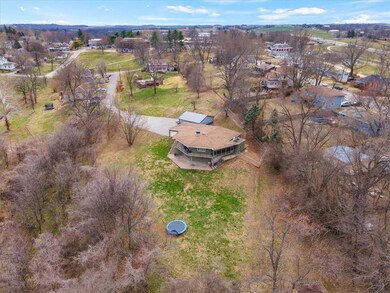
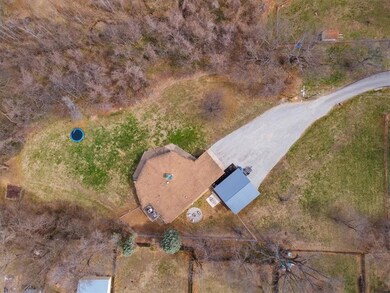
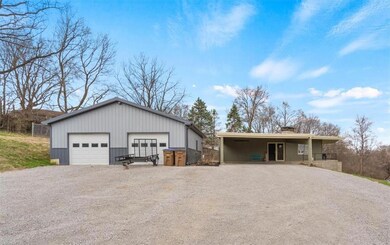
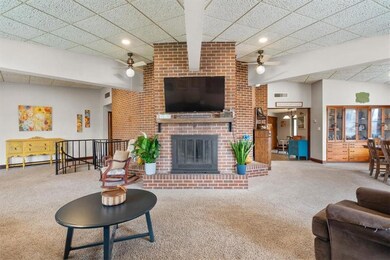
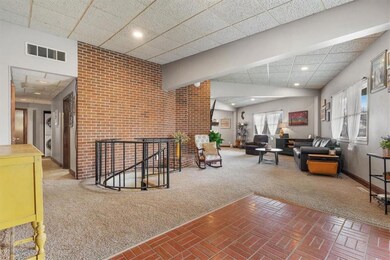
An octagon shaped home sitting on 2.5 acres??? Yes, this house and property really is as cool as it looks in the pictures! You need to see it in person to really appreciate all of the character of this contemporary masterpiece! From the spiral staircase to the cement walls, this one of a kind home (built by a commercial architect), has industrial touches that have turned this residential property into an art piece! With windows and a porch that wraps all the way around, you have beautiful views of the large, 2.5 acre treed lot and the creek that borders the property. The home is tucked back at the end of a street giving it a very secluded feel, even though it's in the middle of a neighborhood in the city! The two car garage is insulated and heated with additional space for a full workshop, exercise room, and more. Where else can you find an open concept home with a screened in wrap around porch, finished walk-out basement, master suite, unique architectural design that is both interesting and appealing...all on a huge lot that provides tranquil views??
Last Agent to Sell the Property
KW KANSAS CITY METRO Listed on: 04/05/2023
We collect this data history from publicly available records. To have your information removed, we recommend requesting removal directly through your county’s website.
We collect this data history from publicly available records. To have your information removed, we recommend requesting removal directly through your county’s website.
| Date | Buyer | Sale Price | Title Company |
|---|---|---|---|
| -- | -- |
We collect this data history from publicly available records. To have your information removed, we recommend requesting removal directly through your county’s website.
| Date | Event | Price | List to Sale | Price per Sq Ft |
|---|---|---|---|---|
| 05/18/2023 05/18/23 | Sold | -- | -- | -- |
| 04/11/2023 04/11/23 | Pending | -- | -- | -- |
| 04/04/2023 04/04/23 | For Sale | $285,000 | -- | $84 / Sq Ft |
We collect this data history from publicly available records. To have your information removed, we recommend requesting removal directly through your county’s website.
| Year | Tax Paid | Tax Assessment Tax Assessment Total Assessment is a certain percentage of the fair market value that is determined by local assessors to be the total taxable value of land and additions on the property. | Land | Improvement |
|---|---|---|---|---|
| 2025 | $5,932 | $37,040 | $3,159 | $33,881 |
| 2024 | $53 | $34,470 | $3,566 | $30,904 |
| 2023 | $4,511 | $29,418 | $2,960 | $26,458 |
| 2022 | $3,001 | $19,663 | $2,684 | $16,979 |
| 2021 | $3,001 | $17,556 | $2,546 | $15,010 |
| 2020 | $3,001 | $17,886 | $2,546 | $15,340 |
| 2019 | $2,996 | $17,886 | $2,546 | $15,340 |
| 2018 | $2,980 | $17,709 | $2,546 | $15,163 |
| 2017 | $3,008 | $17,863 | $2,546 | $15,317 |
| 2016 | $3,026 | $18,043 | $2,546 | $15,497 |
| 2015 | -- | $16,315 | $2,546 | $13,769 |
| 2014 | -- | $16,586 | $2,546 | $14,040 |
Seller's Agent in 2023
Thrive Real Estate KC Team
KW KANSAS CITY METRO
(913) 825-7720
2 in this area
1,057 Total Sales
J
Seller Co-Listing Agent in 2023
Juel Perry
KW KANSAS CITY METRO
(561) 889-3108
1 in this area
9 Total Sales
O
Buyer's Agent in 2023
Olivia Fishburn
Fishburn Realty, LLC
(816) 739-9213
5 in this area
37 Total Sales
Source: Heartland MLS
MLS Number: 2428432
APN: 0030911201002001020
Disclaimer: Certain information contained herein is derived from information provided by parties other than Homes.com. All information provided is deemed reliable, but is not guaranteed to be accurate and should be independently verified.
![]() All data is obtained from various sources and may not have been verified by broker or MLS GRID. Supplied Open House Information is subject to change without notice. All information should be independently reviewed and verified for accuracy. Properties may or may not be listed by the office/agent presenting the information. Some IDX listings have been excluded from this website. Prices displayed on all Sold listings are the Last Known Listing Price and may not be the actual selling price.
All data is obtained from various sources and may not have been verified by broker or MLS GRID. Supplied Open House Information is subject to change without notice. All information should be independently reviewed and verified for accuracy. Properties may or may not be listed by the office/agent presenting the information. Some IDX listings have been excluded from this website. Prices displayed on all Sold listings are the Last Known Listing Price and may not be the actual selling price.
Listings courtesy of Heartland MLS as distributed by MLS GRID.
Based on information submitted to the MLS GRID
Listing Information presented by local MLS brokerage: TEN-X, INC., local REALTOR®- Arlene Richardson - (888) 952-6393
Ask me questions while you tour the home.