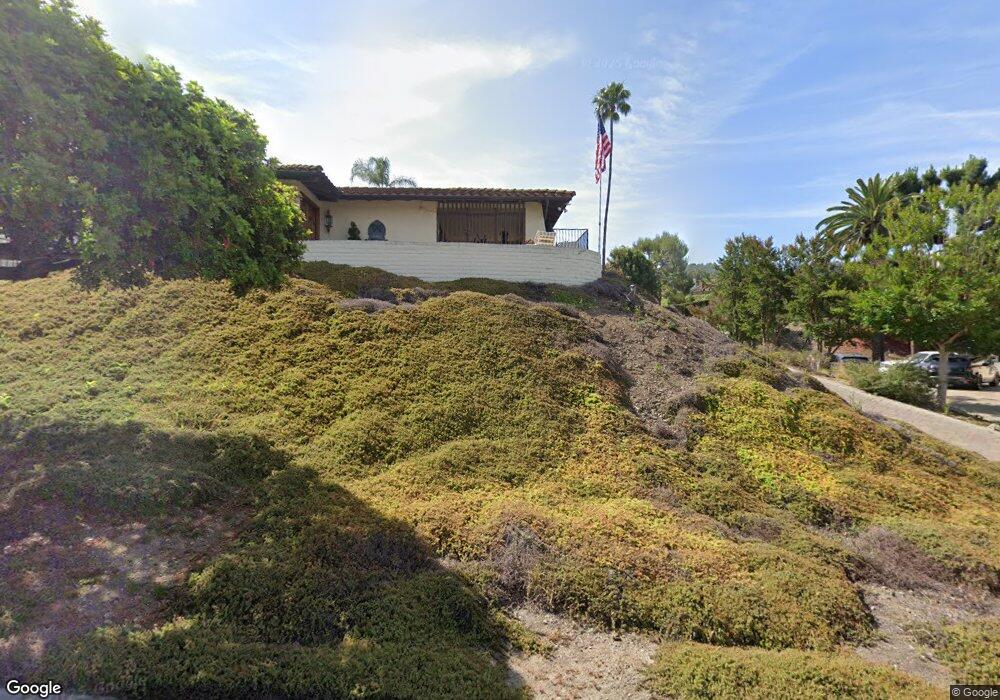
1221 S Montezuma Way West Covina, CA 91791
South Hills NeighborhoodEstimated Value: $1,341,000 - $1,524,000
3
Beds
3
Baths
2,952
Sq Ft
$476/Sq Ft
Est. Value
About This Home
This home is located at 1221 S Montezuma Way, West Covina, CA 91791 and is currently estimated at $1,405,987, approximately $476 per square foot. 1221 S Montezuma Way is a home located in Los Angeles County with nearby schools including Vine Elementary School, Hollencrest Middle School, and West Covina High School.
Ownership History
Date
Name
Owned For
Owner Type
Purchase Details
Closed on
Sep 12, 2024
Sold by
Fathalla Elshazly Helal and Issa Noha Mohamed
Bought by
Elshazly Helal Fathalla and Noha Mohamed
Current Estimated Value
Purchase Details
Closed on
Apr 26, 2007
Sold by
Leffler Charles Allen and Leffler Linda Ruth
Bought by
Fathall Elshazly Helal and Issa Noha Mohamed
Home Financials for this Owner
Home Financials are based on the most recent Mortgage that was taken out on this home.
Original Mortgage
$660,000
Interest Rate
6.15%
Mortgage Type
Purchase Money Mortgage
Purchase Details
Closed on
Apr 25, 1999
Sold by
Leffler Charles A and Leffler Linda R
Bought by
Leffler Charles Allen and Leffler Linda Ruth
Create a Home Valuation Report for This Property
The Home Valuation Report is an in-depth analysis detailing your home's value as well as a comparison with similar homes in the area
Home Values in the Area
Average Home Value in this Area
Purchase History
| Date | Buyer | Sale Price | Title Company |
|---|---|---|---|
| Elshazly Helal Fathalla | -- | None Listed On Document | |
| Fathall Elshazly Helal | $850,000 | Commerce Title | |
| Leffler Charles Allen | -- | -- |
Source: Public Records
Mortgage History
| Date | Status | Borrower | Loan Amount |
|---|---|---|---|
| Previous Owner | Fathall Elshazly Helal | $660,000 |
Source: Public Records
Tax History Compared to Growth
Tax History
| Year | Tax Paid | Tax Assessment Tax Assessment Total Assessment is a certain percentage of the fair market value that is determined by local assessors to be the total taxable value of land and additions on the property. | Land | Improvement |
|---|---|---|---|---|
| 2025 | $13,659 | $1,138,805 | $911,051 | $227,754 |
| 2024 | $13,659 | $1,116,477 | $893,188 | $223,289 |
| 2023 | $12,960 | $1,094,586 | $875,675 | $218,911 |
| 2022 | $13,084 | $1,073,124 | $858,505 | $214,619 |
| 2021 | $12,715 | $1,052,083 | $841,672 | $210,411 |
| 2019 | $12,386 | $1,020,879 | $816,708 | $204,171 |
| 2018 | $11,803 | $1,000,863 | $800,695 | $200,168 |
| 2016 | $10,820 | $962,001 | $769,604 | $192,397 |
| 2015 | $9,724 | $867,200 | $694,500 | $172,700 |
| 2014 | $9,844 | $867,200 | $694,500 | $172,700 |
Source: Public Records
Map
Nearby Homes
- 2829 Countrywood Ln
- 1103 Novarro St
- 1501 S Alpine Dr
- 2839 Horizon Hills Dr
- 2828 Far View Ln
- 1515 S Westridge Rd
- 2969 E Hillside Dr
- 920 S Spring Meadow Dr
- 1278 Inspiration Point
- 859 S Hillward Ave
- 2127 Abrazo Dr Unit 2
- 1507 Elkwood Dr Unit 61
- 1539 Elkwood Dr
- 1124 S Cajon Ave
- 3050 Sunrise Rd
- 910 S Donna Beth Ave
- 1408 Millcreek
- 1813 Borrego Dr
- 631 S Hillward Ave
- 19519 Mulberry Dr
- 1223 S Montezuma Way
- 1219 S Montezuma Way
- 2424 Crescent View Dr
- 1217 S Montezuma Way
- 1301 S Golden Vista Dr
- 1303 S Golden Vista Dr
- 2420 Crescent View Dr
- 2425 Crescent View Dr
- 1218 S Sandy Hill Dr
- 1307 S Golden Vista Dr
- 2416 Crescent View Dr
- 1220 S Montezuma Way
- 1300 S Golden Vista Dr
- 1224 S Montezuma Way
- 2419 Crescent View Dr
- 1220 S Sandy Hill Dr
- 1228 S Montezuma Way
- 1328 S Sandy Hill Dr
- 1216 S Montezuma Way
- 1311 S Golden Vista Dr