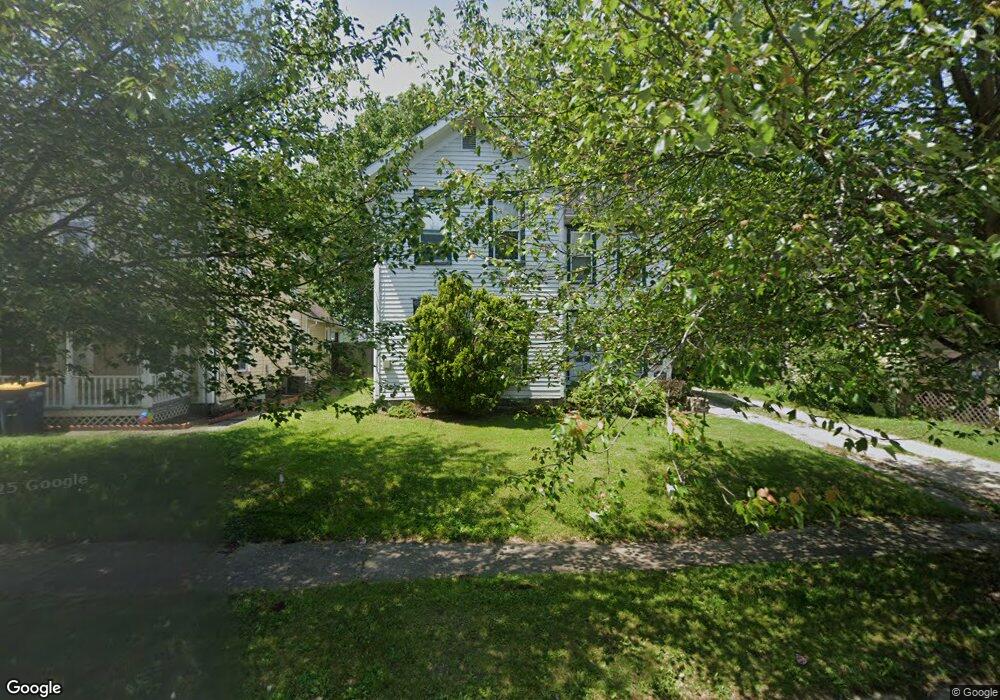
1221 W 8th St Ashtabula, OH 44004
Estimated Value: $85,000 - $123,000
3
Beds
2
Baths
1,586
Sq Ft
$67/Sq Ft
Est. Value
About This Home
This home is located at 1221 W 8th St, Ashtabula, OH 44004 and is currently estimated at $105,783, approximately $66 per square foot. 1221 W 8th St is a home located in Ashtabula County with nearby schools including Lakeside High School and Christian Faith Academy.
Ownership History
Date
Name
Owned For
Owner Type
Purchase Details
Closed on
Sep 30, 2004
Sold by
Keenan Krisia
Bought by
Loveridge James
Current Estimated Value
Purchase Details
Closed on
May 21, 2004
Sold by
M F Ashtabula Ltd
Bought by
Loveridge James and Keenan Krisia
Purchase Details
Closed on
Dec 11, 2002
Sold by
Shrf Teresa Perkins Pr
Bought by
Us Bank Na
Purchase Details
Closed on
May 12, 1999
Sold by
Fish Robert
Bought by
Perkins Theresa
Home Financials for this Owner
Home Financials are based on the most recent Mortgage that was taken out on this home.
Original Mortgage
$35,055
Interest Rate
7.04%
Mortgage Type
New Conventional
Purchase Details
Closed on
Aug 8, 1995
Sold by
Varner James L
Bought by
Fish Robert and Lopez Raymond
Create a Home Valuation Report for This Property
The Home Valuation Report is an in-depth analysis detailing your home's value as well as a comparison with similar homes in the area
Home Values in the Area
Average Home Value in this Area
Purchase History
We collect this data history from publicly available records. To have your information removed, we recommend requesting removal directly through your county’s website.
| Date | Buyer | Sale Price | Title Company |
|---|---|---|---|
| Loveridge James | -- | -- | |
| Loveridge James | $91,500 | Ashtabula Land Title | |
| Us Bank Na | $30,000 | -- | |
| Perkins Theresa | $36,900 | -- | |
| Fish Robert | $26,600 | -- |
Source: Public Records
Mortgage History
We collect this data history from publicly available records. To have your information removed, we recommend requesting removal directly through your county’s website.
| Date | Status | Borrower | Loan Amount |
|---|---|---|---|
| Previous Owner | Perkins Theresa | $35,055 |
Source: Public Records
Tax History
| Year | Tax Paid | Tax Assessment Tax Assessment Total Assessment is a certain percentage of the fair market value that is determined by local assessors to be the total taxable value of land and additions on the property. | Land | Improvement |
|---|---|---|---|---|
| 2025 | $1,822 | $20,730 | $4,660 | $16,070 |
| 2024 | $1,833 | $20,730 | $4,660 | $16,070 |
| 2023 | $1,092 | $20,730 | $4,660 | $16,070 |
| 2022 | $990 | $16,420 | $3,570 | $12,850 |
| 2021 | $997 | $16,420 | $3,570 | $12,850 |
| 2020 | $1,012 | $16,420 | $3,570 | $12,850 |
| 2019 | $1,168 | $18,170 | $3,820 | $14,350 |
| 2018 | $1,068 | $18,170 | $3,820 | $14,350 |
| 2017 | $1,066 | $18,170 | $3,820 | $14,350 |
| 2016 | $1,045 | $17,050 | $3,570 | $13,480 |
| 2015 | $1,018 | $17,050 | $3,570 | $13,480 |
| 2014 | $993 | $17,050 | $3,570 | $13,480 |
| 2013 | $681 | $12,290 | $2,210 | $10,080 |
Source: Public Records
Map
Nearby Homes
- 1411 Bridge St
- 231 Lake Ave
- 1646 Walnut Blvd
- 1631 W 8th St
- 306 Pennsylvania Ave
- 1708 W 8th St
- 1723 Harbor Ave
- 1728 Harbor Ave
- 1926 Walnut Blvd
- 612 Thayer Ave
- 909 E 16th St
- 0 E 7th St
- 814 Richards Ave
- 919 E 17th St
- 725 Union Ave
- 1421 Ohio Ave
- Carpenter W 19th Rd
- 950 Southwood Dr
- 0 E 23rd St Unit 5187222
- 2679 Walnut Blvd
Your Personal Tour Guide
Ask me questions while you tour the home.