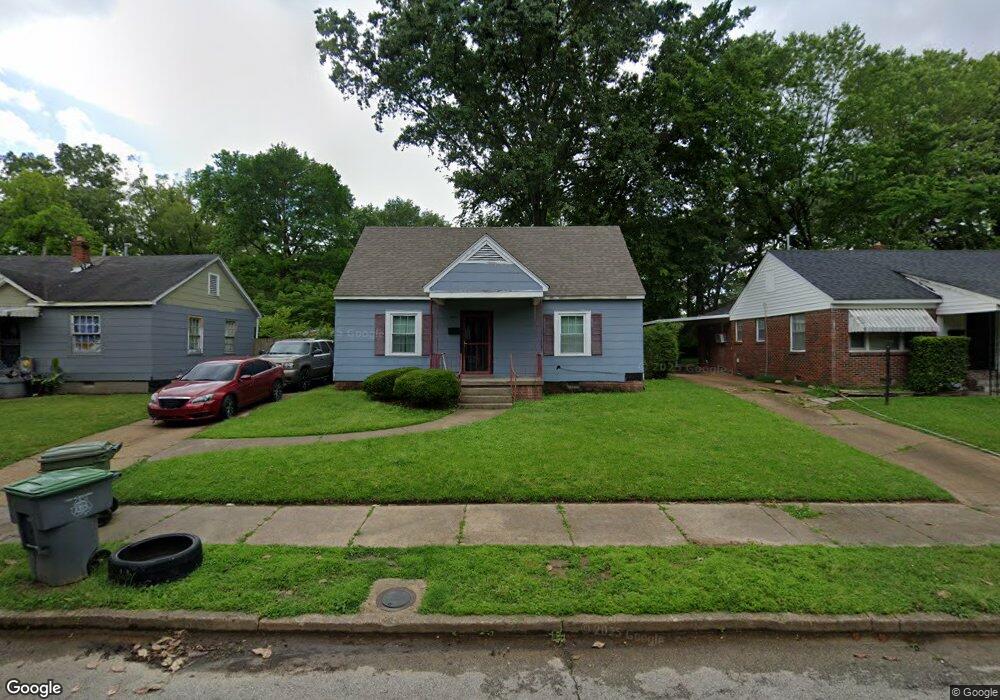
1221 W Goodman Cir Memphis, TN 38111
Audubon Park NeighborhoodEstimated Value: $85,257 - $119,000
4
Beds
2
Baths
1,632
Sq Ft
$61/Sq Ft
Est. Value
About This Home
This home is located at 1221 W Goodman Cir, Memphis, TN 38111 and is currently estimated at $99,064, approximately $60 per square foot. 1221 W Goodman Cir is a home located in Shelby County with nearby schools including Sherwood Elementary School, Sherwood Middle, and Melrose High School.
Ownership History
Date
Name
Owned For
Owner Type
Purchase Details
Closed on
Dec 15, 2023
Sold by
Vb Eight Llc
Bought by
Vb Three Llc
Current Estimated Value
Purchase Details
Closed on
Dec 21, 2022
Sold by
Vb One Llc
Bought by
Vb Eight Llc
Purchase Details
Closed on
Oct 6, 2022
Sold by
Glaud R Kuykendall R and Glaud Elizabeth M
Bought by
Vb One Llc
Purchase Details
Closed on
Jan 25, 2017
Sold by
Kuykendall Glaud and Kuykendall Elizabeth
Bought by
Kuykendall Glaud K and Kuykendall Elizabeth M
Purchase Details
Closed on
Oct 30, 2007
Sold by
Kuykendall Glaud
Bought by
Kuykendall Glaud and Kuykendall Elizabeth
Home Financials for this Owner
Home Financials are based on the most recent Mortgage that was taken out on this home.
Original Mortgage
$59,200
Interest Rate
6.26%
Mortgage Type
New Conventional
Purchase Details
Closed on
Apr 27, 2007
Sold by
Bright Charles H
Bought by
Kuykendall Glaud
Create a Home Valuation Report for This Property
The Home Valuation Report is an in-depth analysis detailing your home's value as well as a comparison with similar homes in the area
Home Values in the Area
Average Home Value in this Area
Purchase History
| Date | Buyer | Sale Price | Title Company |
|---|---|---|---|
| Vb Three Llc | $1,624,100 | None Listed On Document | |
| Vb Eight Llc | $45,500 | Total Title Services | |
| Vb One Llc | $90,000 | Total Title Services | |
| Kuykendall Glaud K | -- | None Available | |
| Kuykendall Glaud | -- | Professional Title & Escrow | |
| Kuykendall Glaud | $59,900 | None Available |
Source: Public Records
Mortgage History
| Date | Status | Borrower | Loan Amount |
|---|---|---|---|
| Previous Owner | Kuykendall Glaud | $59,200 |
Source: Public Records
Tax History Compared to Growth
Tax History
| Year | Tax Paid | Tax Assessment Tax Assessment Total Assessment is a certain percentage of the fair market value that is determined by local assessors to be the total taxable value of land and additions on the property. | Land | Improvement |
|---|---|---|---|---|
| 2025 | $386 | $21,850 | $2,250 | $19,600 |
| 2024 | $386 | $11,375 | $1,725 | $9,650 |
| 2023 | $693 | $11,375 | $1,725 | $9,650 |
| 2022 | $693 | $11,375 | $1,725 | $9,650 |
| 2021 | $392 | $11,375 | $1,725 | $9,650 |
| 2020 | $706 | $9,750 | $1,725 | $8,025 |
| 2019 | $312 | $9,750 | $1,725 | $8,025 |
| 2018 | $312 | $9,750 | $1,725 | $8,025 |
| 2017 | $319 | $9,750 | $1,725 | $8,025 |
| 2016 | $393 | $9,000 | $0 | $0 |
| 2014 | $393 | $9,000 | $0 | $0 |
Source: Public Records
Map
Nearby Homes
- 1249 W Goodman Cir
- 3715 Barron Ave
- 3801 Wilshire Rd
- 3707 Wilshire Rd
- 3909 Fizer Ave
- 3672 Maid Marian Ln
- 1118 Robin Hood Ln
- 3776 Kimball Ave
- 1009 McEvers Rd
- 3607 Vanuys Rd
- 3845 Kimball Ave
- 991 McEvers Rd
- 955 Goodman St
- 3553 Rhodes Ave
- 3704 Friar Tuck Rd
- 3537 Deerwood Ave
- 3784 Dunn Ave
- 3515 Vanuys Rd
- 1486 Patterson St
- 886 Echles St
- 1227 W Goodman Cir
- 1217 W Goodman Cir
- 1233 W Goodman Cir
- 1222 Will Scarlet Rd
- 1226 Will Scarlet Rd
- 1216 Will Scarlet Rd
- 3803 Rhodes Ave
- 3793 Rhodes Ave
- 1232 Will Scarlet Rd
- 1239 W Goodman Cir
- 1220 W Goodman Cir
- 1226 W Goodman Cir
- 1214 W Goodman Cir
- 1232 W Goodman Cir
- 1238 Will Scarlet Rd
- 1245 W Goodman Cir
- 3815 Rhodes Ave
- 1244 Will Scarlet Rd
- 1246 W Goodman Cir
- 1229 Will Scarlet Rd