Estimated Value: $363,442 - $459,000
2
Beds
1
Bath
852
Sq Ft
$493/Sq Ft
Est. Value
About This Home
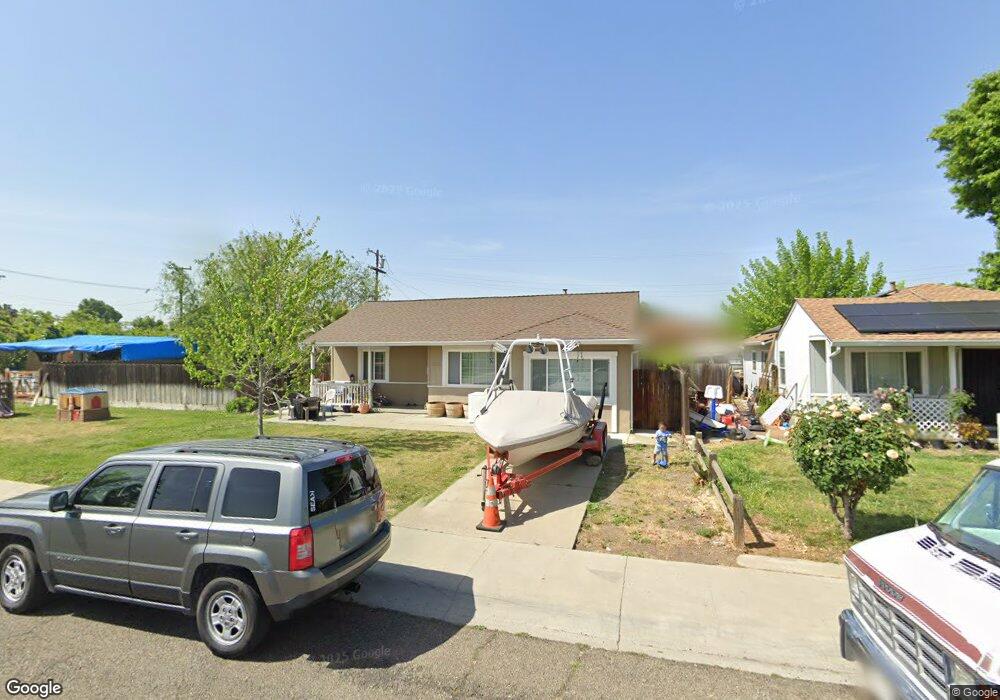
This home is located at 1221 Wilson Ave, Tracy, CA 95376 and is currently estimated at $419,611, approximately $492 per square foot. 1221 Wilson Ave is a home located in San Joaquin County with nearby schools including McKinley Elementary School, Monte Vista Middle School, and Merrill F. West High School.
Ownership History
Date
Name
Owned For
Owner Type
Purchase Details
Closed on
May 18, 2010
Sold by
Nigg Geraldine Jeanette
Bought by
Nigg Albert F and Nigg Geraldine J
Current Estimated Value
Purchase Details
Closed on
Sep 15, 2003
Sold by
Dutra Lena Dolores
Bought by
Dutra Lena Dolores and The Lena Dolores Dutra Revocab
Home Financials for this Owner
Home Financials are based on the most recent Mortgage that was taken out on this home.
Original Mortgage
$98,000
Interest Rate
6.22%
Mortgage Type
Purchase Money Mortgage
Purchase Details
Closed on
Apr 20, 2000
Sold by
Dutra Lena and Dutra Lena D
Bought by
Dutra Lena Dolores and Lena Dolores Dutra Revocable T
Purchase Details
Closed on
Mar 17, 1999
Sold by
Dolores Dutra Lena and Joseph Clyde
Bought by
Dutra Lena D
Home Financials for this Owner
Home Financials are based on the most recent Mortgage that was taken out on this home.
Original Mortgage
$103,200
Interest Rate
6.79%
Create a Home Valuation Report for This Property
The Home Valuation Report is an in-depth analysis detailing your home's value as well as a comparison with similar homes in the area
Home Values in the Area
Average Home Value in this Area
Purchase History
| Date | Buyer | Sale Price | Title Company |
|---|---|---|---|
| Nigg Albert F | -- | None Available | |
| Nigg Geraldine Jeanette | -- | None Available | |
| Dutra Lena Dolores | -- | Chicago Title Co | |
| Dutra Lena Dolores | -- | Chicago Title Co | |
| Dutra Lena Dolores | -- | -- | |
| Dutra Lena D | -- | Alliance Title Company |
Source: Public Records
Mortgage History
| Date | Status | Borrower | Loan Amount |
|---|---|---|---|
| Closed | Dutra Lena Dolores | $98,000 | |
| Closed | Dutra Lena D | $103,200 |
Source: Public Records
Tax History
| Year | Tax Paid | Tax Assessment Tax Assessment Total Assessment is a certain percentage of the fair market value that is determined by local assessors to be the total taxable value of land and additions on the property. | Land | Improvement |
|---|---|---|---|---|
| 2025 | $972 | $82,848 | $41,424 | $41,424 |
| 2024 | $896 | $81,224 | $40,612 | $40,612 |
| 2023 | $883 | $79,632 | $39,816 | $39,816 |
| 2022 | $865 | $78,072 | $39,036 | $39,036 |
| 2021 | $855 | $76,542 | $38,271 | $38,271 |
| 2020 | $849 | $75,758 | $37,879 | $37,879 |
| 2019 | $836 | $74,274 | $37,137 | $37,137 |
| 2018 | $822 | $72,818 | $36,409 | $36,409 |
| 2017 | $782 | $71,392 | $35,696 | $35,696 |
| 2016 | $791 | $69,992 | $34,996 | $34,996 |
| 2014 | $740 | $67,590 | $33,795 | $33,795 |
Source: Public Records
Map
Nearby Homes
- 920 Taft Ave
- 1416 Audrey Dr
- 1241 Parker Ave Unit 1
- 1243 Parker Ave Unit 2
- 1245 Parker Ave Unit 3
- 1410 Mcdermott Ct
- 1610 Bondy Ln
- 206 W 12th St
- 1651 W Beverly Place
- 535 W Lowell Ave
- 345 W Carlton Way
- 539 W Lowell Ave
- 214 W 7th St
- 445 W Lowell Ave
- 1551 Autumn Meadow Ln
- 143 W Beverly Place
- 1636 Parker Ave
- 262 W Lowell Ave
- 1827 Groveview Way
- 550 Fawn Glen Dr
- 1231 Wilson Ave
- 1220 Harding Ave
- 1230 Harding Ave
- 1201 Wilson Ave
- 1241 Wilson Ave
- 1240 Harding Ave
- 1210 Harding Ave
- 1251 Wilson Ave
- 1250 Harding Ave
- 1210 Wilson Ave
- 1220 Wilson Ave
- 1255 Wilson Ave
- 1240 Wilson Ave
- 1260 Harding Ave
- 1261 Wilson Ave
- 1200 Wilson Ave
- 1250 Wilson Ave
- 1201 N Tracy Blvd
- 1221 Harding Ave
- 1231 Harding Ave
Your Personal Tour Guide
Ask me questions while you tour the home.