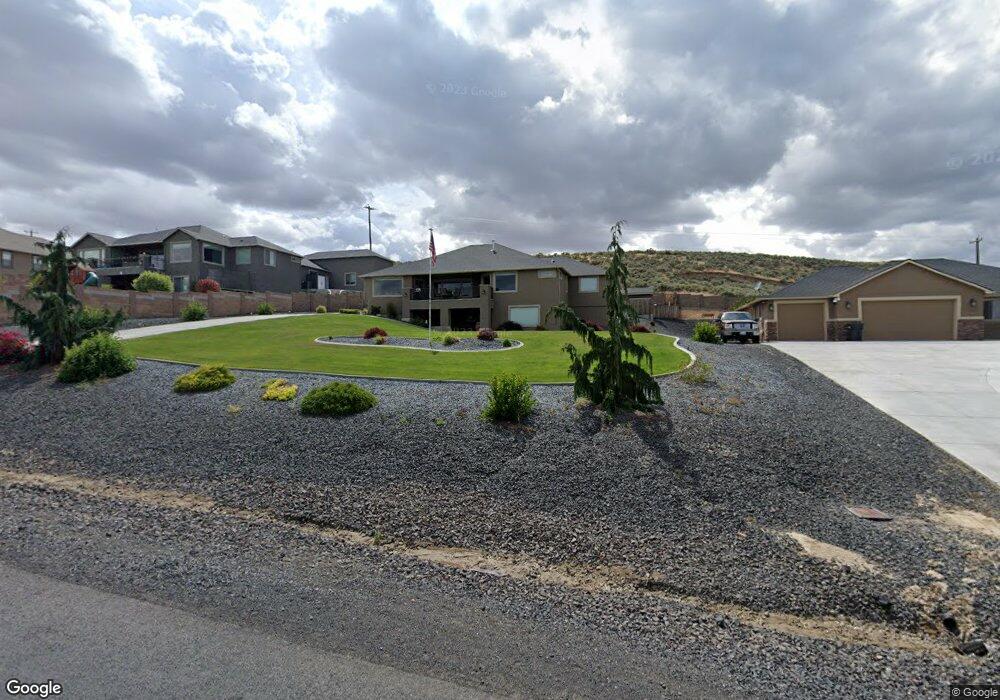
12210 Grandview Ln Unit New Construction / V Kennewick, WA 99338
Estimated Value: $708,755 - $796,000
4
Beds
3
Baths
1,996
Sq Ft
$375/Sq Ft
Est. Value
About This Home
This home is located at 12210 Grandview Ln Unit New Construction / V, Kennewick, WA 99338 and is currently estimated at $747,939, approximately $374 per square foot. 12210 Grandview Ln Unit New Construction / V is a home located in Benton County with nearby schools including Cottonwood Elementary School, Desert Hills Middle School, and Kamiakin High School.
Ownership History
Date
Name
Owned For
Owner Type
Purchase Details
Closed on
May 23, 2024
Sold by
Naida Stanley S and Naida Sally J
Bought by
Westervelt Robert and Westervelt Mary Ann
Current Estimated Value
Purchase Details
Closed on
May 5, 2017
Sold by
Dennis Sawby Construction Llc
Bought by
Naida Stanley S and Naida Sally J
Home Financials for this Owner
Home Financials are based on the most recent Mortgage that was taken out on this home.
Original Mortgage
$170,000
Interest Rate
4.08%
Mortgage Type
VA
Purchase Details
Closed on
Mar 9, 2016
Sold by
Tri City Development Corporation
Bought by
Dennis Sawby Construction Llc
Home Financials for this Owner
Home Financials are based on the most recent Mortgage that was taken out on this home.
Original Mortgage
$310,506
Interest Rate
3.79%
Mortgage Type
Construction
Create a Home Valuation Report for This Property
The Home Valuation Report is an in-depth analysis detailing your home's value as well as a comparison with similar homes in the area
Home Values in the Area
Average Home Value in this Area
Purchase History
| Date | Buyer | Sale Price | Title Company |
|---|---|---|---|
| Westervelt Robert | $558,708 | None Listed On Document | |
| Naida Stanley S | $386,712 | Cascade Title Company | |
| Dennis Sawby Construction Llc | $44,697 | Chicago Title |
Source: Public Records
Mortgage History
| Date | Status | Borrower | Loan Amount |
|---|---|---|---|
| Previous Owner | Naida Stanley S | $170,000 | |
| Previous Owner | Dennis Sawby Construction Llc | $310,506 |
Source: Public Records
Tax History Compared to Growth
Tax History
| Year | Tax Paid | Tax Assessment Tax Assessment Total Assessment is a certain percentage of the fair market value that is determined by local assessors to be the total taxable value of land and additions on the property. | Land | Improvement |
|---|---|---|---|---|
| 2024 | $5,768 | $682,940 | $110,000 | $572,940 |
| 2023 | $5,768 | $642,010 | $110,000 | $532,010 |
| 2022 | $4,698 | $471,410 | $55,000 | $416,410 |
| 2021 | $4,354 | $431,110 | $55,000 | $376,110 |
| 2020 | $4,680 | $390,810 | $55,000 | $335,810 |
| 2019 | $4,532 | $404,250 | $55,000 | $349,250 |
| 2018 | $4,366 | $404,250 | $55,000 | $349,250 |
| 2017 | $3,789 | $323,650 | $55,000 | $268,650 |
| 2016 | -- | $303,740 | $58,000 | $245,740 |
| 2015 | $688 | $58,000 | $58,000 | $0 |
| 2014 | -- | $53,400 | $53,400 | $0 |
| 2013 | -- | $53,400 | $53,400 | $0 |
Source: Public Records
Map
Nearby Homes
- 82503 E Wallowa Rd
- 9915 S Grandview Ln
- 84905 E Wallowa Rd
- 3677 Nuthatch St
- 3733 Nuthatch St
- 3741 Nuthatch St
- 3718 Nuthatch St
- 13730 S Furlong Ln
- 87626 E Calico Rd
- 87069 E Haven View Prairie SE
- 2988 Tarragon Ave
- 2972 Tarragon Ave
- 3788 Scout St
- 3802 Scout St
- 2956 Tarragon Ave
- 3789 Boxberger
- 3776 Boxberger St
- 76704 E Timothy Ln
- 89703 E Sagebrush Rd
- 3587 Morningside Pkwy
- 12210 Grandview Ln
- 12012 Grandview Ln
- 12508 Grandview Ln
- 11814 Grandview Ln
- 11814 Grandview Ln Unit "$35,000 PRICE REDUC
- 11814 Grandview Ln Unit Over 1/2 an Acre!!
- 12706 Grandview Ln
- 12211 S Grandview Ln
- 12211 S Grandview Ln Unit amazing view
- 12409 S Grandview Ln
- 12013 S Grandview Ln
- 12607 S Grandview Ln
- 11815 S Grandview Ln
- 11616 S Grandview Ln
- 12904 Grandview Ln
- 1250 Grandview Ln
- 12805 S Grandview Ln
- 11617 S Grandview Ln
- 11418 Grandview Ln
- 13102 Grandview Ln