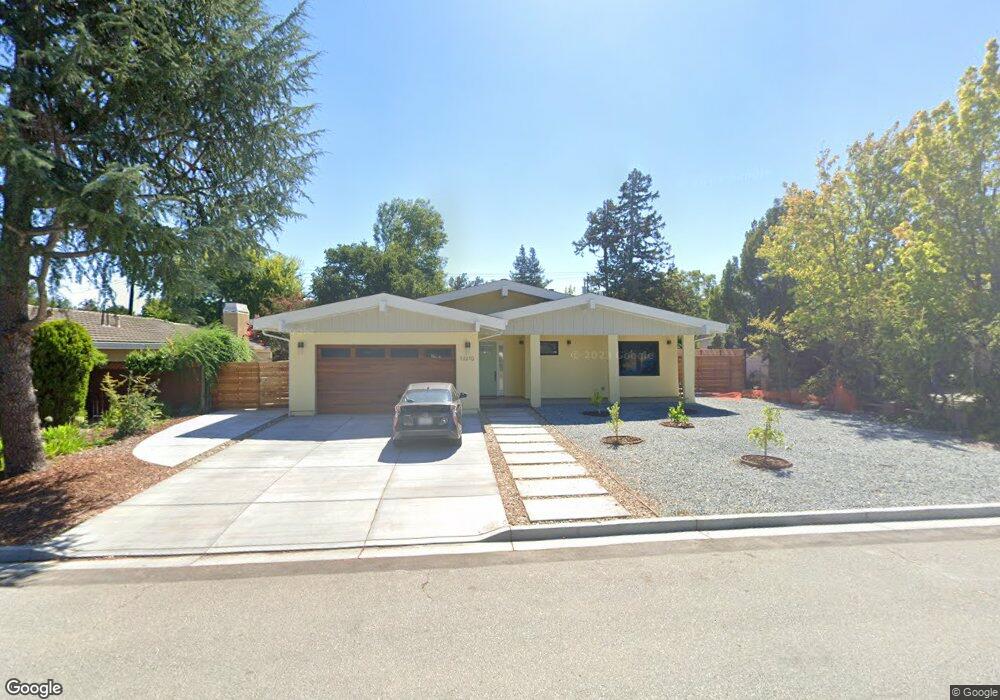
12210 Mellowood Dr Saratoga, CA 95070
West San Jose NeighborhoodEstimated Value: $1,095,674 - $3,020,000
3
Beds
2
Baths
1,973
Sq Ft
$821/Sq Ft
Est. Value
About This Home
This home is located at 12210 Mellowood Dr, Saratoga, CA 95070 and is currently estimated at $1,619,919, approximately $821 per square foot. 12210 Mellowood Dr is a home located in Santa Clara County with nearby schools including Country Lane Elementary School, Moreland Middle School, and Prospect High School.
Ownership History
Date
Name
Owned For
Owner Type
Purchase Details
Closed on
Aug 22, 2025
Sold by
Mark J Mikl Living Trust and Mikl Marcus J
Bought by
Mjm Mellowood Llc
Current Estimated Value
Purchase Details
Closed on
Jun 27, 2025
Sold by
Mark J Mikl Living Trust and Mikl Mark J
Bought by
Mikl Marcus J
Purchase Details
Closed on
Oct 22, 2024
Sold by
Mikl Mark J
Bought by
Mark J Mikl Living Trust and Mikl
Purchase Details
Closed on
Mar 14, 2022
Sold by
Mikl Mark J
Bought by
Mikl Mark J
Home Financials for this Owner
Home Financials are based on the most recent Mortgage that was taken out on this home.
Original Mortgage
$1,100,000
Interest Rate
2.88%
Mortgage Type
New Conventional
Purchase Details
Closed on
Dec 19, 2019
Sold by
Mikl Mark J and The Hana Miki Living Trust
Bought by
Mikl Mark J
Purchase Details
Closed on
Apr 24, 2007
Sold by
Mikl Hana
Bought by
Mikl Hana and The Hana Mikl Living Trust
Create a Home Valuation Report for This Property
The Home Valuation Report is an in-depth analysis detailing your home's value as well as a comparison with similar homes in the area
Home Values in the Area
Average Home Value in this Area
Purchase History
| Date | Buyer | Sale Price | Title Company |
|---|---|---|---|
| Mjm Mellowood Llc | -- | None Listed On Document | |
| Mikl Marcus J | $1,100,000 | None Listed On Document | |
| Mark J Mikl Living Trust | -- | None Listed On Document | |
| Mikl Mark J | -- | Ticor Title | |
| Mikl Mark J | -- | None Available | |
| Mikl Hana | -- | None Available |
Source: Public Records
Mortgage History
| Date | Status | Borrower | Loan Amount |
|---|---|---|---|
| Previous Owner | Mikl Mark J | $1,100,000 |
Source: Public Records
Tax History Compared to Growth
Tax History
| Year | Tax Paid | Tax Assessment Tax Assessment Total Assessment is a certain percentage of the fair market value that is determined by local assessors to be the total taxable value of land and additions on the property. | Land | Improvement |
|---|---|---|---|---|
| 2025 | $9,459 | $703,801 | $39,240 | $664,561 |
| 2024 | $9,459 | $690,002 | $38,471 | $651,531 |
| 2023 | $9,372 | $676,473 | $37,717 | $638,756 |
| 2022 | $9,234 | $663,210 | $36,978 | $626,232 |
| 2021 | $2,087 | $90,655 | $36,253 | $54,402 |
| 2020 | $2,033 | $89,727 | $35,882 | $53,845 |
| 2019 | $1,866 | $87,969 | $35,179 | $52,790 |
| 2018 | $1,811 | $86,245 | $34,490 | $51,755 |
| 2017 | $1,828 | $84,555 | $33,814 | $50,741 |
| 2016 | $1,594 | $82,898 | $33,151 | $49,747 |
| 2015 | $1,543 | $81,654 | $32,654 | $49,000 |
| 2014 | $1,481 | $80,056 | $32,015 | $48,041 |
Source: Public Records
Map
Nearby Homes
- 12140 Woodside Dr
- 5635 W Walbrook Dr
- 1577 Maurice Ln
- 1587 Miller Ave
- 1681 Danromas Way
- 12584 Paseo Flores
- 1367 Cordelia Ave
- 11315 Cottonwood Place Unit 39-09 Plan 3
- 11210 Cottonwood Place Unit 35-08 Plan 4
- 10750 Elm Cir Unit 88-17 Plan 2
- 11220 Cottonwood Place Unit 36-08 Plan 2
- Plan 2 at The Elms
- Plan 3 at The Elms
- Plan 4 at The Elms
- 11010 Maple Place Unit 25-06 Plan 4
- 19920 Viewridge Dr
- 11240 Cottonwood Place Unit 38-08 Plan 3
- 11645 Redwood Place Unit 56-12 Plan 4
- 19423 Vineyard Ln
- 10730 Elm Cir Unit 86-17 Plan 2
- 12200 Mellowood Dr
- 12220 Mellowood Dr
- 12235 Brookglen Dr
- 12249 Brookglen Dr
- 12221 Brookglen Dr
- 12190 Mellowood Dr
- 12230 Mellowood Dr
- 12211 Mellowood Dr
- 12201 Mellowood Dr
- 12221 Mellowood Dr
- 12263 Brookglen Dr
- 12207 Brookglen Dr
- 12191 Mellowood Dr
- 12180 Mellowood Dr
- 12240 Mellowood Dr
- 12271 Mellowood Dr
- 12277 Brookglen Dr
- 12193 Brookglen Dr
- 12181 Mellowood Dr
- 12170 Mellowood Dr