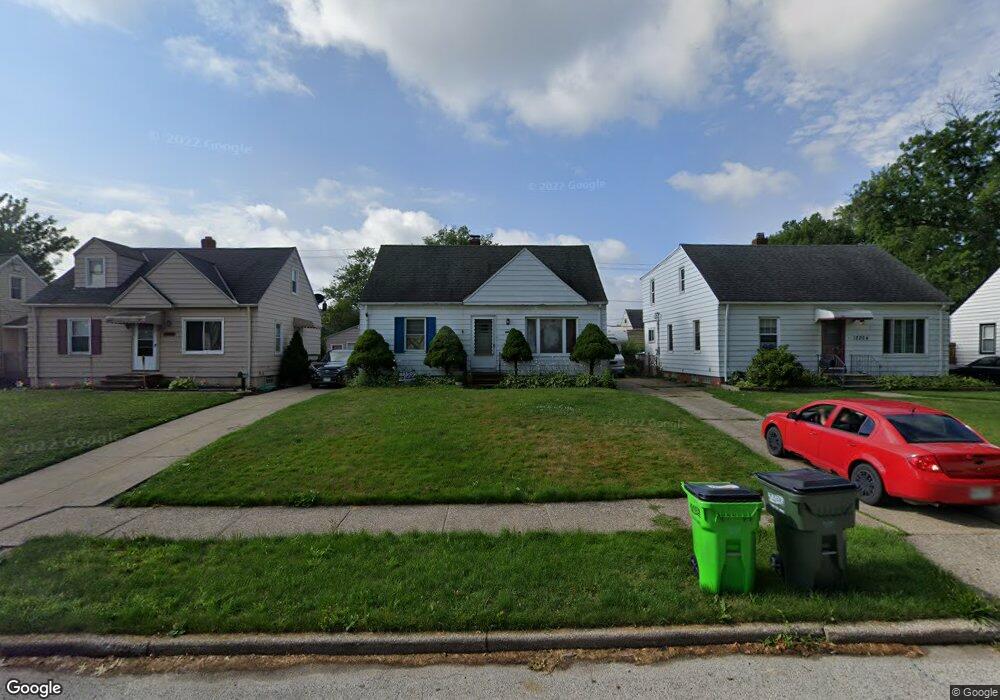
12210 Shady Oak Blvd Unit D Cleveland, OH 44125
Estimated Value: $82,000 - $124,000
3
Beds
2
Baths
1,080
Sq Ft
$100/Sq Ft
Est. Value
About This Home
This home is located at 12210 Shady Oak Blvd Unit D, Cleveland, OH 44125 and is currently estimated at $107,579, approximately $99 per square foot. 12210 Shady Oak Blvd Unit D is a home located in Cuyahoga County with nearby schools including Garfield Heights High School, North Shore High School, and St Benedict Catholic School.
Ownership History
Date
Name
Owned For
Owner Type
Purchase Details
Closed on
Feb 21, 2012
Sold by
Thies Michael L and Thies Vicky S
Bought by
Thies Michael L and Thies Vicky S
Current Estimated Value
Purchase Details
Closed on
Feb 14, 2012
Sold by
Hvisdow John J
Bought by
Thies Michael L
Purchase Details
Closed on
May 17, 2001
Sold by
Vana Judy Firzlaff Jay and Vana Richard
Bought by
Hvisdos John J
Home Financials for this Owner
Home Financials are based on the most recent Mortgage that was taken out on this home.
Original Mortgage
$97,825
Interest Rate
7.23%
Mortgage Type
FHA
Purchase Details
Closed on
Jan 8, 1992
Sold by
Firzlaff Frank
Bought by
Vana Judy
Purchase Details
Closed on
Jun 25, 1990
Sold by
Firzlaff Frank
Bought by
Firzlaff Frank
Purchase Details
Closed on
Jan 7, 1986
Sold by
Firzlaff Frank and Firzlaff Marie
Bought by
Firzlaff Frank
Purchase Details
Closed on
Jan 1, 1975
Bought by
Firzlaff Frank and Firzlaff Marie
Create a Home Valuation Report for This Property
The Home Valuation Report is an in-depth analysis detailing your home's value as well as a comparison with similar homes in the area
Home Values in the Area
Average Home Value in this Area
Purchase History
| Date | Buyer | Sale Price | Title Company |
|---|---|---|---|
| Thies Michael L | -- | Attorney | |
| Thies Michael L | $25,000 | Enterprise Title Agency | |
| Hvisdos John J | $99,000 | Real Estate Title | |
| Vana Judy | -- | -- | |
| Firzlaff Frank | -- | -- | |
| Firzlaff Frank | -- | -- | |
| Firzlaff Frank | -- | -- |
Source: Public Records
Mortgage History
| Date | Status | Borrower | Loan Amount |
|---|---|---|---|
| Previous Owner | Hvisdos John J | $97,825 |
Source: Public Records
Tax History Compared to Growth
Tax History
| Year | Tax Paid | Tax Assessment Tax Assessment Total Assessment is a certain percentage of the fair market value that is determined by local assessors to be the total taxable value of land and additions on the property. | Land | Improvement |
|---|---|---|---|---|
| 2024 | $3,957 | $37,555 | $8,505 | $29,050 |
| 2023 | $3,153 | $28,290 | $6,130 | $22,160 |
| 2022 | $3,107 | $28,280 | $6,130 | $22,160 |
| 2021 | $3,283 | $28,280 | $6,130 | $22,160 |
| 2020 | $2,819 | $22,610 | $4,900 | $17,710 |
| 2019 | $2,794 | $64,600 | $14,000 | $50,600 |
| 2018 | $2,792 | $22,610 | $4,900 | $17,710 |
| 2017 | $2,812 | $21,350 | $4,060 | $17,290 |
| 2016 | $2,853 | $21,350 | $4,060 | $17,290 |
| 2015 | $2,742 | $21,350 | $4,060 | $17,290 |
| 2014 | $2,742 | $22,470 | $4,270 | $18,200 |
Source: Public Records
Map
Nearby Homes
- 12119 Woodward Blvd
- 12214 Woodward Blvd
- 12324 Oak Park Blvd
- 12313 Eastwood Blvd
- 11808 Fordham Rd
- 12813 Oak Park Blvd
- 11611 Fordham Rd
- 11813 Willard Ave
- 12512 York Blvd
- 12913 Darlington Ave
- 13012 Oak Park Blvd
- 13009 Oak Park Blvd
- 12812 Maple Leaf Dr
- 5570 Cumberland Dr
- 5781 Turney Rd
- 13206 Shady Oak Blvd
- 13300 Shady Oak Blvd
- 12408 Thraves Ave
- 12911 Bangor Ave
- 13402 Shady Oak Blvd
- 12210 Shady Oak Blvd
- 12214 Shady Oak Blvd
- 12204 Shady Oak Blvd
- 12302 Shady Oak Blvd
- 12200 Shady Oak Blvd
- 12211 Woodward Blvd
- 12205 Woodward Blvd
- 12306 Shady Oak Blvd
- 12215 Woodward Blvd
- 12118 Shady Oak Blvd
- 12219 Woodward Blvd
- 12211 Shady Oak Blvd
- 12115 Woodward Blvd
- 12215 Shady Oak Blvd
- 12205 Shady Oak Blvd
- 12310 Shady Oak Blvd
- 12303 Shady Oak Blvd
- 12114 Shady Oak Blvd
- 12309 Woodward Blvd
- 12111 Woodward Blvd