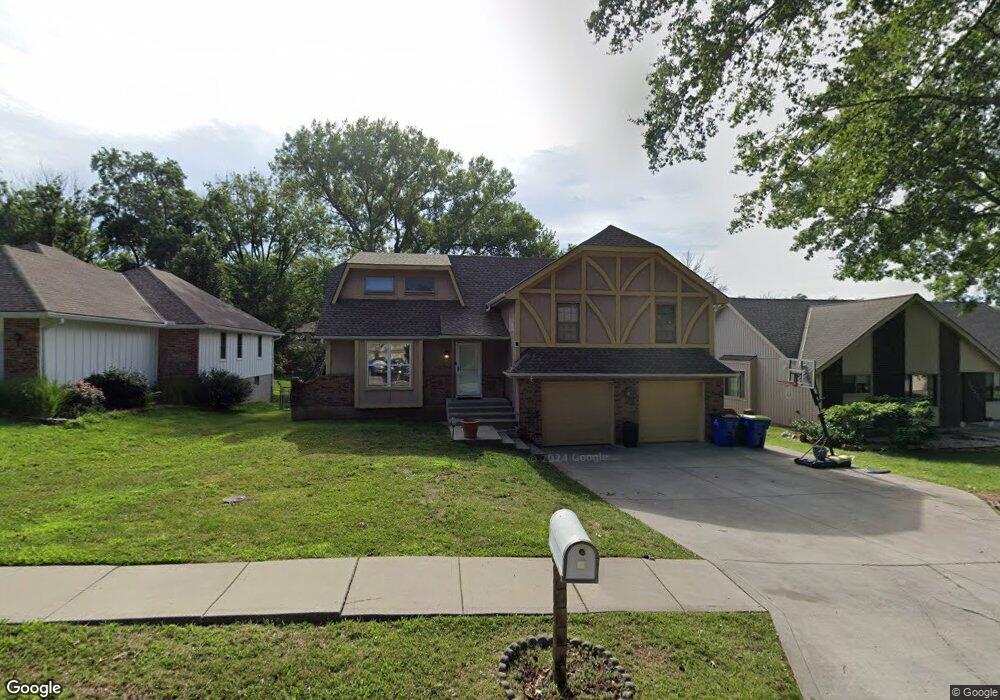
12214 W 72nd St Shawnee, KS 66216
Estimated Value: $379,987 - $388,000
4
Beds
3
Baths
1,664
Sq Ft
$231/Sq Ft
Est. Value
About This Home
This home is located at 12214 W 72nd St, Shawnee, KS 66216 and is currently estimated at $384,497, approximately $231 per square foot. 12214 W 72nd St is a home located in Johnson County with nearby schools including Rhein Benninghoven Elementary School, Trailridge Middle School, and Shawnee Mission Northwest High School.
Ownership History
Date
Name
Owned For
Owner Type
Purchase Details
Closed on
Aug 22, 2017
Sold by
Jarrett Louis M
Bought by
Burks Sandra and Jarrett Sandra
Current Estimated Value
Purchase Details
Closed on
Oct 26, 2006
Sold by
Burks Sandra
Bought by
Burks Sandra and Jarrett Louis M
Home Financials for this Owner
Home Financials are based on the most recent Mortgage that was taken out on this home.
Original Mortgage
$151,400
Interest Rate
6.28%
Mortgage Type
New Conventional
Purchase Details
Closed on
Oct 19, 2006
Sold by
Garcia Robert D and Garcia Linda P
Bought by
Burks Sandra
Home Financials for this Owner
Home Financials are based on the most recent Mortgage that was taken out on this home.
Original Mortgage
$151,400
Interest Rate
6.28%
Mortgage Type
New Conventional
Create a Home Valuation Report for This Property
The Home Valuation Report is an in-depth analysis detailing your home's value as well as a comparison with similar homes in the area
Home Values in the Area
Average Home Value in this Area
Purchase History
| Date | Buyer | Sale Price | Title Company |
|---|---|---|---|
| Burks Sandra | -- | None Available | |
| Burks Sandra | -- | Kansas City Title | |
| Burks Sandra | -- | Metropolitan Title & Escrow |
Source: Public Records
Mortgage History
| Date | Status | Borrower | Loan Amount |
|---|---|---|---|
| Previous Owner | Burks Sandra | $151,400 | |
| Previous Owner | Burks Sandra | $7,000 |
Source: Public Records
Tax History Compared to Growth
Tax History
| Year | Tax Paid | Tax Assessment Tax Assessment Total Assessment is a certain percentage of the fair market value that is determined by local assessors to be the total taxable value of land and additions on the property. | Land | Improvement |
|---|---|---|---|---|
| 2024 | $4,994 | $38,030 | $7,277 | $30,753 |
| 2023 | $4,578 | $36,144 | $7,277 | $28,867 |
| 2022 | $3,475 | $32,315 | $6,323 | $25,992 |
| 2021 | $4,255 | $29,164 | $5,747 | $23,417 |
| 2020 | $4,144 | $28,002 | $5,224 | $22,778 |
| 2019 | $3,671 | $25,633 | $4,748 | $20,885 |
| 2018 | $3,480 | $25,116 | $4,748 | $20,368 |
| 2017 | $2,719 | $22,896 | $4,127 | $18,769 |
| 2016 | $3,340 | $21,551 | $4,127 | $17,424 |
| 2015 | $2,444 | $21,125 | $4,127 | $16,998 |
| 2013 | -- | $19,446 | $4,127 | $15,319 |
Source: Public Records
Map
Nearby Homes
- 12403 W 72nd Terrace
- 7130 Westgate St
- Augusta Plan at Kenneth Estates
- Newport Plan at Kenneth Estates
- Rosemount II Plan at Kenneth Estates
- The Avala Villa Plan at Kenneth Estates
- The Rosemount Villa Plan at Kenneth Estates
- Catalina II Plan at Kenneth Estates
- The Avala Plan at Kenneth Estates
- 12811 W 71st St
- 7107 Garnett St
- 7115 Richards Dr
- 7105 Richards Dr
- 13100 W 72nd St
- 12300 W 67th Terrace
- 7526 Monrovia St
- 11406 W 71st St
- 11637 W 68th Terrace
- 6610 Halsey St
- 11217 W 69th Terrace
- 12210 W 72nd St
- 12220 W 72nd St
- 7130 Halsey Dr
- 12224 W 72nd St
- 12202 W 72nd St
- 7134 Halsey Dr
- 7126 Halsey Dr
- 12213 W 72nd St
- 12217 W 72nd St
- 7122 Halsey Dr
- 7138 Halsey Dr
- 12209 W 72nd St
- 12226 W 72nd St
- 12221 W 72nd St
- 12205 W 72nd St
- 12225 W 72nd St
- 7118 Halsey Dr
- 12201 W 72nd St
- 12230 W 72nd St
- 7135 Caenen Ave