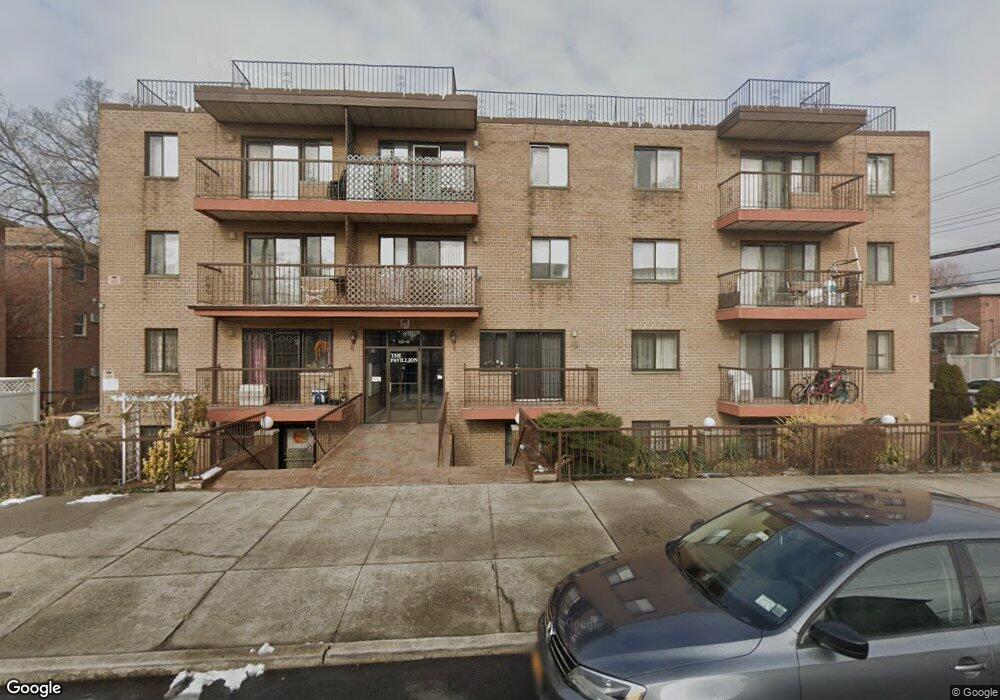
12215 25th Rd Unit Cf1 Flushing, NY 11354
College Point NeighborhoodEstimated Value: $253,281
--
Bed
--
Bath
912
Sq Ft
$278/Sq Ft
Est. Value
About This Home
This home is located at 12215 25th Rd Unit Cf1, Flushing, NY 11354 and is currently estimated at $253,281, approximately $277 per square foot. 12215 25th Rd Unit Cf1 is a home located in Queens County with nearby schools including P.S. 29, Flushing High School, and Promise Christian Academy.
Ownership History
Date
Name
Owned For
Owner Type
Purchase Details
Closed on
Jan 12, 2024
Sold by
Tai Shan Construction Llc
Bought by
Gemicious Inc
Current Estimated Value
Purchase Details
Closed on
Dec 22, 2017
Sold by
Adenwala Mohamed I
Bought by
Tai Shan Construction Llc
Purchase Details
Closed on
Aug 2, 2017
Sold by
Edwards Geoffrey S and Edwards Maureen A
Bought by
Adenwala Mohamed I
Purchase Details
Closed on
Aug 12, 2014
Sold by
Joseph Boscarino As Trustee and The Bruchi Family Trust
Bought by
Joseph Boscarino As Trustee and The Roy T Bruchi Irrevocable Trust
Purchase Details
Closed on
Sep 7, 2005
Sold by
Abdeldaim Claire
Bought by
Edwards Geoffrey S and Edwards Maureen A
Purchase Details
Closed on
Dec 2, 1996
Sold by
Neerg Second Corp
Bought by
Abdeldaim Claire
Create a Home Valuation Report for This Property
The Home Valuation Report is an in-depth analysis detailing your home's value as well as a comparison with similar homes in the area
Home Values in the Area
Average Home Value in this Area
Purchase History
| Date | Buyer | Sale Price | Title Company |
|---|---|---|---|
| Gemicious Inc | $250,000 | -- | |
| Gemicious Inc | $250,000 | -- | |
| Tai Shan Construction Llc | $125,000 | -- | |
| Tai Shan Construction Llc | $125,000 | -- | |
| Adenwala Mohamed I | $90,000 | -- | |
| Adenwala Mohamed I | $90,000 | -- | |
| Joseph Boscarino As Trustee | -- | -- | |
| Joseph Boscarino As Trustee | -- | -- | |
| Joseph Boscarino As Trustee | -- | -- | |
| Edwards Geoffrey S | $190,000 | -- | |
| Edwards Geoffrey S | $190,000 | -- | |
| Abdeldaim Claire | $60,000 | Ticor Title Guarantee Compan | |
| Abdeldaim Claire | $60,000 | Ticor Title Guarantee Compan |
Source: Public Records
Tax History Compared to Growth
Tax History
| Year | Tax Paid | Tax Assessment Tax Assessment Total Assessment is a certain percentage of the fair market value that is determined by local assessors to be the total taxable value of land and additions on the property. | Land | Improvement |
|---|---|---|---|---|
| 2025 | $12,497 | $116,681 | $22,514 | $94,167 |
| 2024 | $12,497 | $117,983 | $20,181 | $97,802 |
| 2023 | $12,520 | $118,207 | $17,848 | $100,359 |
| 2022 | $5,826 | $111,350 | $22,514 | $88,836 |
| 2021 | $12,346 | $115,759 | $22,514 | $93,245 |
| 2020 | $11,022 | $115,907 | $10,851 | $105,056 |
| 2019 | $10,358 | $114,804 | $10,851 | $103,953 |
| 2018 | $9,662 | $91,901 | $10,851 | $81,050 |
| 2017 | $8,924 | $84,875 | $10,851 | $74,024 |
| 2016 | $8,595 | $84,875 | $10,851 | $74,024 |
| 2015 | $5,707 | $77,032 | $10,851 | $66,181 |
| 2014 | $5,707 | $74,420 | $10,847 | $63,573 |
Source: Public Records
Map
Nearby Homes
- 12214 25th Ave Unit 3A
- 12206 25th Ave Unit 2A
- 5-05 College Point Blvd
- 25-22 College Point Blvd
- 12411 25th Ave
- 2559 123rd St
- 23-13 123rd St
- 25-56 120th St Unit 2C
- 238 College Point Blvd
- 23-06 College Point Blvd
- 12208 23rd Ave
- 122-08 23rd Ave
- 25-02 120th St Unit 2
- 2232 124th St
- 11950 27th Ave
- 119-26 27th Ave
- 2521 127th St
- 12011 28th Ave
- 25-72 127th St
- 126-01 23rd Ave
- 12215 25th Rd Unit 203
- 12215 25th Rd Unit 105
- 12215 25th Rd Unit 304
- 12215 25th Rd Unit 101
- 12215 25th Rd Unit 204
- 12215 25th Rd Unit 305
- 12215 25th Rd
- 12215 25th Rd Unit 201
- 12215 25th Rd Unit 102
- 12215 25th Rd Unit 301
- 12215 25th Rd Unit 303
- 12215 25th Rd
- 12215 25th Rd Unit 104
- 12215 25th Rd Unit 103
- 12215 25th Rd Unit CF2
- 12215 25th Rd Unit 303
- 12215 25th Rd Unit 302
- 12215 25th Rd Unit CF3
- 12215 25th Rd Unit 203
- 12215 25th Rd Unit Cf2