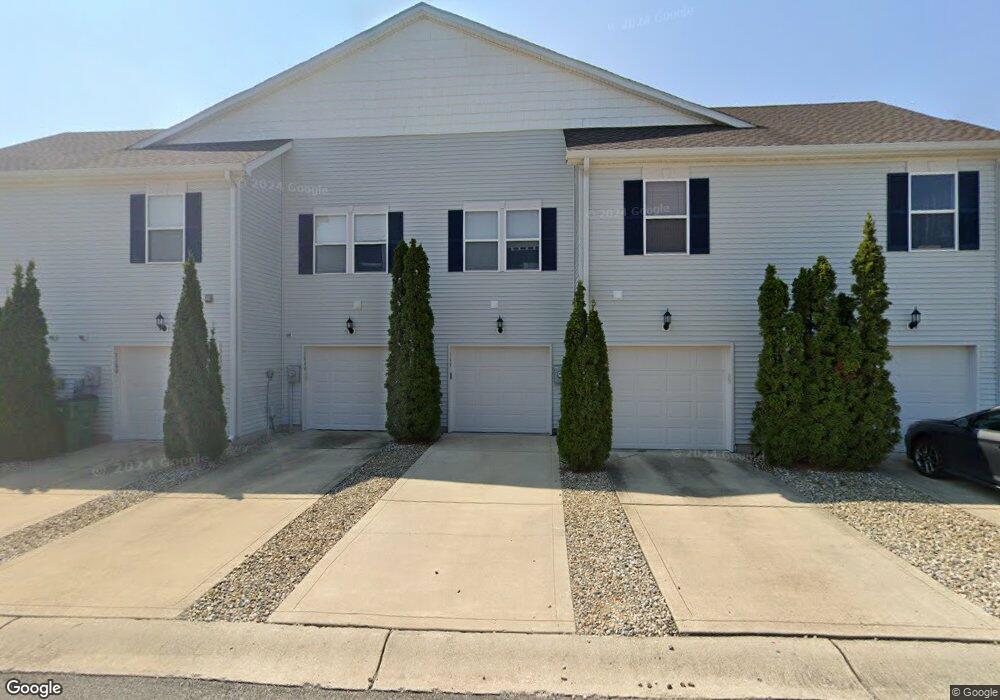
12215 Pebble St Unit 4 Fishers, IN 46038
Estimated Value: $222,000 - $234,000
3
Beds
2
Baths
1,326
Sq Ft
$172/Sq Ft
Est. Value
About This Home
This home is located at 12215 Pebble St Unit 4, Fishers, IN 46038 and is currently estimated at $227,699, approximately $171 per square foot. 12215 Pebble St Unit 4 is a home located in Hamilton County with nearby schools including Sand Creek Elementary School, Sand Creek Intermediate School, and Fishers Junior High School.
Ownership History
Date
Name
Owned For
Owner Type
Purchase Details
Closed on
Nov 30, 2021
Sold by
Scarborough Daniel O
Bought by
Reeve Jenny L
Current Estimated Value
Home Financials for this Owner
Home Financials are based on the most recent Mortgage that was taken out on this home.
Original Mortgage
$166,250
Outstanding Balance
$152,865
Interest Rate
3.09%
Mortgage Type
New Conventional
Estimated Equity
$74,834
Purchase Details
Closed on
Oct 15, 2014
Sold by
Srmof Ii 2012 I Trust
Bought by
Scarborough Daniel O
Purchase Details
Closed on
Feb 16, 2014
Sold by
Adduci Dina
Bought by
Srmof Ii 2012 1 Trust Co
Purchase Details
Closed on
Jun 28, 2006
Sold by
Centex Homes
Bought by
Adduci Dina
Home Financials for this Owner
Home Financials are based on the most recent Mortgage that was taken out on this home.
Original Mortgage
$113,513
Interest Rate
6.73%
Mortgage Type
FHA
Create a Home Valuation Report for This Property
The Home Valuation Report is an in-depth analysis detailing your home's value as well as a comparison with similar homes in the area
Home Values in the Area
Average Home Value in this Area
Purchase History
| Date | Buyer | Sale Price | Title Company |
|---|---|---|---|
| Reeve Jenny L | $175,000 | Enterprise Title | |
| Scarborough Daniel O | -- | Prism Title & Closing Svcs L | |
| Srmof Ii 2012 1 Trust Co | $69,000 | None Available | |
| Adduci Dina | -- | None Available |
Source: Public Records
Mortgage History
| Date | Status | Borrower | Loan Amount |
|---|---|---|---|
| Open | Reeve Jenny L | $166,250 | |
| Previous Owner | Adduci Dina | $113,513 |
Source: Public Records
Tax History Compared to Growth
Tax History
| Year | Tax Paid | Tax Assessment Tax Assessment Total Assessment is a certain percentage of the fair market value that is determined by local assessors to be the total taxable value of land and additions on the property. | Land | Improvement |
|---|---|---|---|---|
| 2024 | $1,588 | $189,700 | $24,000 | $165,700 |
| 2023 | $1,588 | $170,100 | $24,000 | $146,100 |
| 2022 | $1,234 | $148,200 | $24,000 | $124,200 |
| 2021 | $1,234 | $132,900 | $24,000 | $108,900 |
| 2020 | $1,229 | $125,100 | $24,000 | $101,100 |
| 2019 | $1,017 | $110,600 | $20,900 | $89,700 |
| 2018 | $1,033 | $111,600 | $20,900 | $90,700 |
| 2017 | $850 | $100,000 | $20,900 | $79,100 |
| 2016 | $812 | $97,800 | $20,900 | $76,900 |
| 2014 | $673 | $93,500 | $20,900 | $72,600 |
| 2013 | $673 | $94,300 | $20,900 | $73,400 |
Source: Public Records
Map
Nearby Homes
- 13415 White Granite Dr Unit 600
- 13410 White Granite Dr Unit 1100
- 12075 Scoria Dr Unit 500
- 13355 Heroic Way
- 12236 Quarterback Ln
- 12404 Titans Dr
- 12694 Justice Crossing
- 12599 Brookdale Dr
- 12054 Seahawks Ln
- 11581 Beardsley Way
- 12890 Old Glory Dr
- 12925 Old Glory Dr
- 12957 E 131st St
- 13703 Van Buren Place
- 13315 Patriotic Way
- 0 Marilyn Rd
- 14234 Coyote Ridge Dr
- 14231 Coyote Ridge Dr
- The Pendula Plan at Marilyn Woods - The Signature Collection
- The Holbrook Plan at Marilyn Woods - The Courtyard Collection
- 12215 Pebble St Unit 1000
- 12215 Pebble St Unit 700
- 12215 Pebble St Unit 4
- 12215 Pebble St Unit 4
- 12215 Pebble St Unit 4
- 12215 Pebble St Unit 4
- 12215 Pebble St Unit 4
- 12215 Pebble St Unit 4
- 12215 Pebble St Unit 4
- 12215 Pebble St Unit 4
- 12215 Pebble St Unit 4
- 12215 Pebble St Unit 4
- 12215 Pebble St Unit 4
- 12215 Pebble St Unit 1100
- 12215 Pebble St Unit 300
- 12215 Pebble St Unit 200
- 12215 Pebble St Unit 400
- 12215 Pebble St Unit 500
- 12215 Pebble St Unit 800
- 12215 Pebble St