
Seller's Agent in 2025
Wes Johnston
Trueblood Real Estate
(317) 223-3182
1 in this area
36 Total Sales
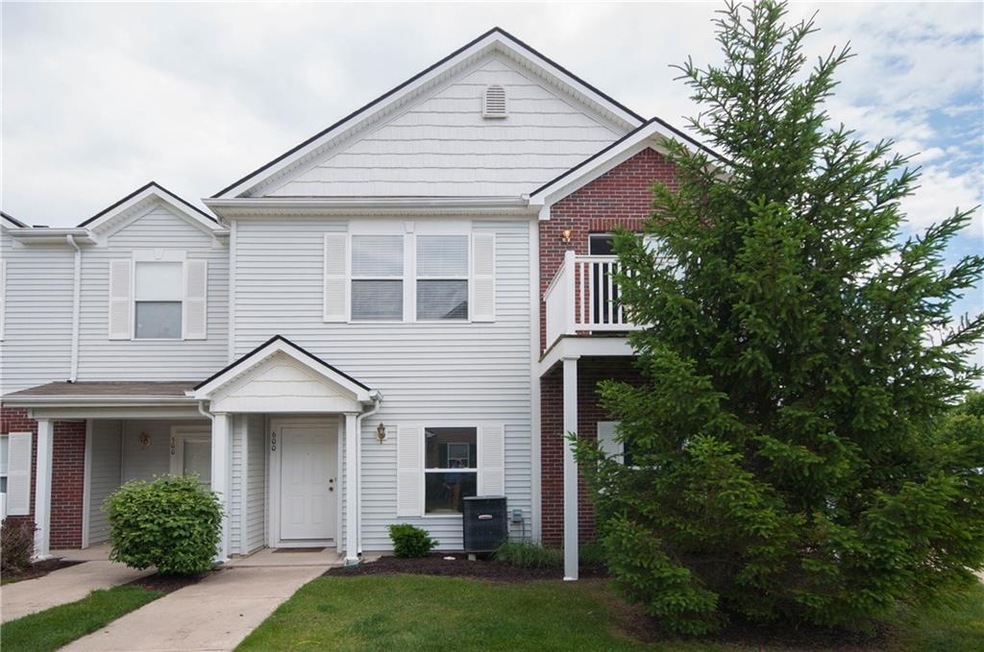
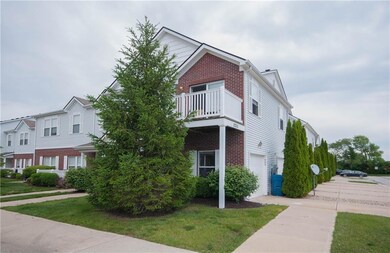
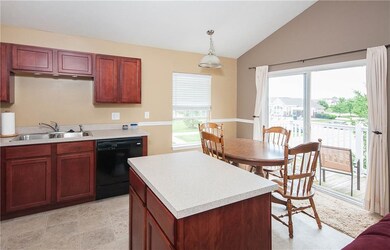
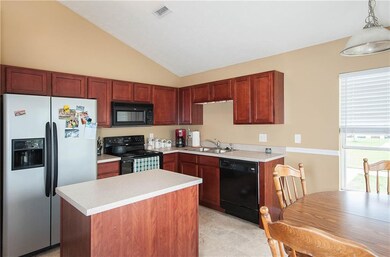
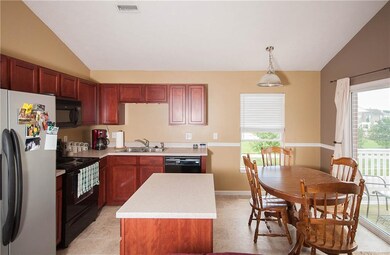
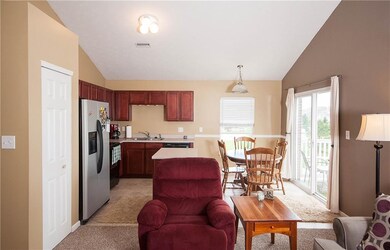
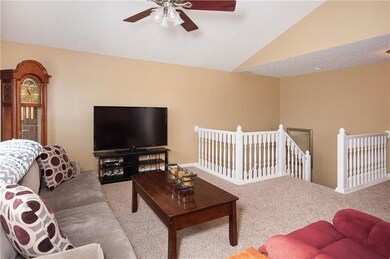
Hard to beat the price & location of Limestone Springs - great value! End unit in premium interior location away from traffic noise, convenient to nbrhd amenities! Brand new carpet, brand new A/C! Spindled staircase provides open feeling in the living rm w/ cathedral ceiling - open to the eat-in kitchen w/ center island & sliding door to balcony. Mstr suite w/ cathedral ceiling & big walk-in closet plus additional loft/office, just the right amount of space. All appliances included!
Last Agent to Sell the Property
Keller Williams Indpls Metro N License #RB14004485 Listed on: 05/31/2017
Last Buyer's Agent
Keller Williams Indpls Metro N License #RB14004485 Listed on: 05/31/2017
| Date | Type | Sale Price | Title Company |
|---|---|---|---|
| Warranty Deed | -- | Drake Andrew R | |
| Warranty Deed | -- | Drake Andrew R | |
| Warranty Deed | -- | Drake Andrew R | |
| Warranty Deed | -- | Meridian Title | |
| Warranty Deed | -- | None Available |
| Date | Status | Loan Amount | Loan Type |
|---|---|---|---|
| Previous Owner | $81,500 | New Conventional | |
| Previous Owner | $93,187 | FHA |
| Date | Event | Price | Change | Sq Ft Price |
|---|---|---|---|---|
| 09/18/2025 09/18/25 | For Sale | $214,900 | +29.5% | $205 / Sq Ft |
| 05/25/2022 05/25/22 | Sold | $166,000 | +3.8% | $158 / Sq Ft |
| 04/14/2022 04/14/22 | Pending | -- | -- | -- |
| 04/11/2022 04/11/22 | For Sale | $160,000 | +57.0% | $153 / Sq Ft |
| 07/21/2017 07/21/17 | Sold | $101,900 | -3.0% | $97 / Sq Ft |
| 07/11/2017 07/11/17 | Pending | -- | -- | -- |
| 05/31/2017 05/31/17 | For Sale | $105,000 | 0.0% | $100 / Sq Ft |
| 09/14/2012 09/14/12 | Rented | $800 | -99.2% | -- |
| 09/14/2012 09/14/12 | Under Contract | -- | -- | -- |
| 09/05/2012 09/05/12 | For Rent | $99,900 | -- | -- |
| Year | Tax Paid | Tax Assessment Tax Assessment Total Assessment is a certain percentage of the fair market value that is determined by local assessors to be the total taxable value of land and additions on the property. | Land | Improvement |
|---|---|---|---|---|
| 2024 | $3,205 | $164,600 | $24,000 | $140,600 |
| 2023 | $3,205 | $147,900 | $24,000 | $123,900 |
| 2022 | $1,187 | $129,400 | $24,000 | $105,400 |
| 2021 | $1,012 | $117,900 | $24,000 | $93,900 |
| 2020 | $983 | $113,200 | $24,000 | $89,200 |
| 2019 | $790 | $100,000 | $20,900 | $79,100 |
| 2018 | $743 | $96,900 | $20,900 | $76,000 |
| 2017 | $581 | $86,500 | $20,900 | $65,600 |
| 2016 | $616 | $84,500 | $20,900 | $63,600 |
| 2014 | $477 | $84,000 | $20,900 | $63,100 |
| 2013 | $477 | $84,700 | $20,900 | $63,800 |
Seller's Agent in 2025
Wes Johnston
Trueblood Real Estate
(317) 223-3182
1 in this area
36 Total Sales
T
Seller's Agent in 2022
Todd Denkmann
Keller Williams Indpls Metro N
R
Buyer's Agent in 2022
Randy Bennett
Trueblood Real Estate
Seller's Agent in 2012
Laura Turner
F.C. Tucker Company
(317) 363-0842
23 in this area
500 Total Sales
Source: MIBOR Broker Listing Cooperative®
MLS Number: MBR21488789
APN: 29-11-27-104-006.000-020
Disclaimer: Certain information contained herein is derived from information provided by parties other than Homes.com. All information provided is deemed reliable, but is not guaranteed to be accurate and should be independently verified.
![]() Based on information submitted to the MLS GRID. All data is obtained from various sources and may not have been verified by broker or MLS GRID. Supplied Open House Information is subject to change without notice. All information should be independently reviewed and verified for accuracy. Properties may or may not be listed by the office/agent presenting the information. Some IDX listings have been excluded from this website.
Based on information submitted to the MLS GRID. All data is obtained from various sources and may not have been verified by broker or MLS GRID. Supplied Open House Information is subject to change without notice. All information should be independently reviewed and verified for accuracy. Properties may or may not be listed by the office/agent presenting the information. Some IDX listings have been excluded from this website.