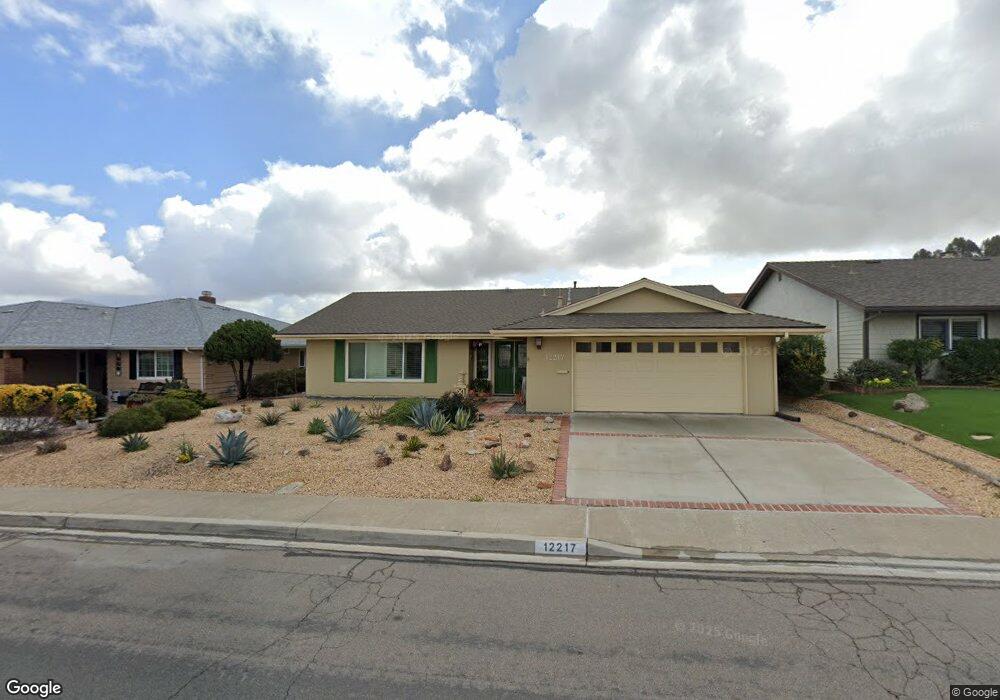
12217 San Tomas Place San Diego, CA 92128
Rancho Bernardo NeighborhoodEstimated Value: $835,543 - $925,000
2
Beds
2
Baths
1,368
Sq Ft
$642/Sq Ft
Est. Value
About This Home
This home is located at 12217 San Tomas Place, San Diego, CA 92128 and is currently estimated at $878,136, approximately $641 per square foot. 12217 San Tomas Place is a home located in San Diego County with nearby schools including Highland Ranch Elementary School, Bernardo Heights Middle, and Rancho Bernardo High.
Ownership History
Date
Name
Owned For
Owner Type
Purchase Details
Closed on
Oct 4, 2016
Sold by
Tarin Anthony Q
Bought by
Thorne Craig G
Current Estimated Value
Home Financials for this Owner
Home Financials are based on the most recent Mortgage that was taken out on this home.
Original Mortgage
$268,500
Outstanding Balance
$215,321
Interest Rate
3.47%
Mortgage Type
New Conventional
Estimated Equity
$662,815
Purchase Details
Closed on
Oct 3, 2016
Sold by
Thorne Craig G
Bought by
Thorne Craig G
Home Financials for this Owner
Home Financials are based on the most recent Mortgage that was taken out on this home.
Original Mortgage
$268,500
Outstanding Balance
$215,321
Interest Rate
3.47%
Mortgage Type
New Conventional
Estimated Equity
$662,815
Purchase Details
Closed on
Oct 31, 2013
Sold by
Thorne Craig G
Bought by
Thorne Craig F
Home Financials for this Owner
Home Financials are based on the most recent Mortgage that was taken out on this home.
Original Mortgage
$244,100
Interest Rate
4.27%
Mortgage Type
New Conventional
Purchase Details
Closed on
May 1, 2009
Sold by
Thorne Cralg Gilmour
Bought by
Thorne Cralg G
Purchase Details
Closed on
May 4, 2006
Sold by
Thorne Craig G
Bought by
Thorne Craig G
Home Financials for this Owner
Home Financials are based on the most recent Mortgage that was taken out on this home.
Original Mortgage
$255,000
Interest Rate
6.3%
Mortgage Type
Fannie Mae Freddie Mac
Purchase Details
Closed on
May 7, 2003
Sold by
Thorne Craig G
Bought by
Thorne Craig G
Home Financials for this Owner
Home Financials are based on the most recent Mortgage that was taken out on this home.
Original Mortgage
$230,000
Interest Rate
5.83%
Mortgage Type
Stand Alone First
Purchase Details
Closed on
Mar 13, 2003
Sold by
Thorne Craig G
Bought by
Thorne Craig G
Home Financials for this Owner
Home Financials are based on the most recent Mortgage that was taken out on this home.
Original Mortgage
$230,000
Interest Rate
5.83%
Mortgage Type
Stand Alone First
Purchase Details
Closed on
Feb 11, 2001
Sold by
Smith La Verne F & Katherine P Trs
Bought by
Thorne Craig G
Home Financials for this Owner
Home Financials are based on the most recent Mortgage that was taken out on this home.
Original Mortgage
$190,000
Interest Rate
6.98%
Create a Home Valuation Report for This Property
The Home Valuation Report is an in-depth analysis detailing your home's value as well as a comparison with similar homes in the area
Home Values in the Area
Average Home Value in this Area
Purchase History
| Date | Buyer | Sale Price | Title Company |
|---|---|---|---|
| Thorne Craig G | -- | North American Title Co Inc | |
| Thorne Craig G | -- | North American Title Co Inc | |
| Thorne Craig G | -- | North American Title Co Inc | |
| Thorne Craig F | -- | Title365 Company | |
| Thorne Craig G | -- | Title365 Company | |
| Thorne Cralg G | -- | Accommodation | |
| Thorne Craig Gilmour | -- | First American Title Company | |
| Thorne Craig Gilmour | -- | First American Title Company | |
| Thorne Craig G | -- | Accommodation | |
| Thorne Craig G | -- | Commonwealth Land Title Co | |
| Thorne Craig G | -- | -- | |
| Thorne Craig G | -- | First American Title Co | |
| Thorne Craig G | $239,000 | First American Title |
Source: Public Records
Mortgage History
| Date | Status | Borrower | Loan Amount |
|---|---|---|---|
| Open | Thorne Craig G | $268,500 | |
| Closed | Thorne Craig G | $244,100 | |
| Closed | Thorne Craig G | $255,000 | |
| Closed | Thorne Craig G | $230,000 | |
| Closed | Thorne Craig G | $190,000 |
Source: Public Records
Tax History Compared to Growth
Tax History
| Year | Tax Paid | Tax Assessment Tax Assessment Total Assessment is a certain percentage of the fair market value that is determined by local assessors to be the total taxable value of land and additions on the property. | Land | Improvement |
|---|---|---|---|---|
| 2025 | $3,952 | $360,108 | $150,985 | $209,123 |
| 2024 | $3,952 | $353,048 | $148,025 | $205,023 |
| 2023 | $3,866 | $346,126 | $145,123 | $201,003 |
| 2022 | $3,801 | $339,340 | $142,278 | $197,062 |
| 2021 | $3,750 | $332,688 | $139,489 | $193,199 |
| 2020 | $3,699 | $329,277 | $138,059 | $191,218 |
| 2019 | $3,603 | $322,821 | $135,352 | $187,469 |
| 2018 | $3,500 | $316,493 | $132,699 | $183,794 |
| 2017 | $83 | $310,289 | $130,098 | $180,191 |
| 2016 | $3,334 | $304,206 | $127,548 | $176,658 |
| 2015 | $3,284 | $299,638 | $125,633 | $174,005 |
| 2014 | $3,206 | $293,770 | $123,173 | $170,597 |
Source: Public Records
Map
Nearby Homes
- 12195 San Tomas Place
- 16421 Ramada Dr
- 12249 Horado Rd
- 12093 Callado Rd
- 12085 Calle de Maria
- 12257 Avenida Consentido
- 12047 Avenida Consentido
- 16515 Felice Dr
- 12365 Horado Rd
- 12424 Rios Rd
- 12206 Fairway Pointe Row
- 16710 Obispo Ln
- 16660 Roca Dr
- 16632 Roca Dr Unit 41
- 12115 Caddy Row
- 16498 Roca Dr
- 12494 Senda Rd
- 16856 Bellota Dr
- 11941 Callado Rd
- 16881 Bellota Dr
- 12211 San Tomas Place
- 12225 San Tomas Place
- 12222 Rios Rd
- 12214 Rios Rd
- 12228 Rios Rd
- 12203 San Tomas Place
- 12210 San Tomas Place
- 16544 San Tomas Dr
- 12208 Rios Rd
- 12196 San Tomas Place
- 12202 Rios Rd
- 16521 San Tomas Dr Unit 16
- 16541 San Tomas Dr
- 16566 San Tomas Dr
- 16501 San Tomas Dr
- 16561 San Tomas Dr
- 12221 San Tomas Ct
- 12227 Rios Rd
- 12184 San Tomas Place
- 12221 Rios Rd