Estimated Value: $664,000 - $767,000
3
Beds
2
Baths
1,511
Sq Ft
$482/Sq Ft
Est. Value
About This Home
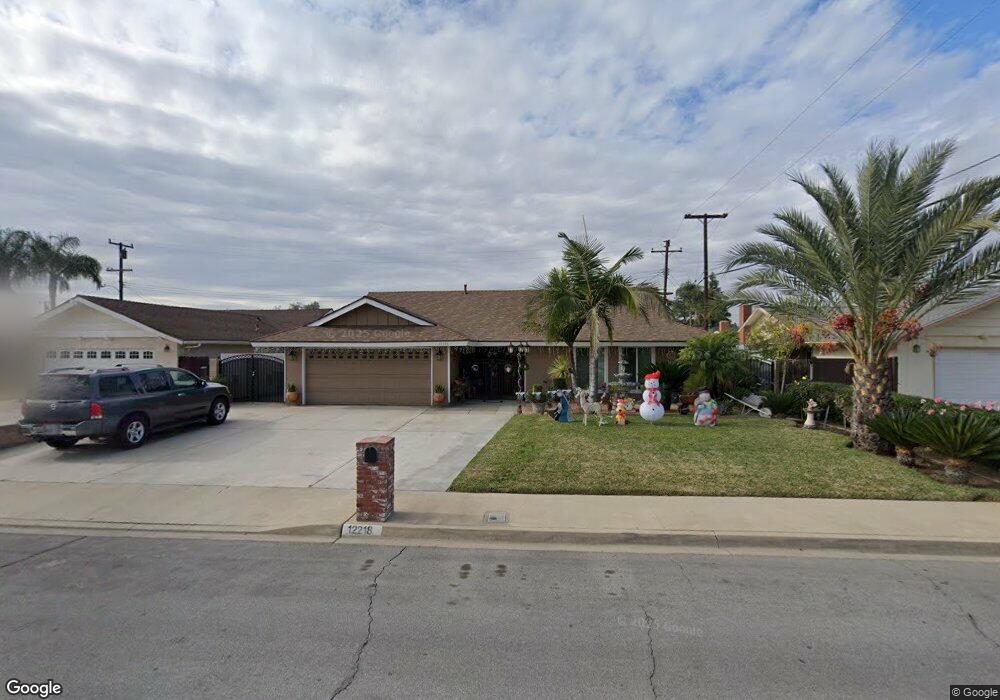
This home is located at 12218 Fuschia Ave, Chino, CA 91710 and is currently estimated at $728,066, approximately $481 per square foot. 12218 Fuschia Ave is a home located in San Bernardino County with nearby schools including Alicia Cortez Elementary, Magnolia Junior High, and Chino High School.
Ownership History
Date
Name
Owned For
Owner Type
Purchase Details
Closed on
Nov 17, 2010
Sold by
Rincon Jeffrey M
Bought by
Guerra Florentino R and Guerra Elpidia
Current Estimated Value
Home Financials for this Owner
Home Financials are based on the most recent Mortgage that was taken out on this home.
Original Mortgage
$199,900
Interest Rate
4.34%
Mortgage Type
New Conventional
Purchase Details
Closed on
Feb 8, 2006
Sold by
Rincon Candice M
Bought by
Rincon Jeffrey M
Home Financials for this Owner
Home Financials are based on the most recent Mortgage that was taken out on this home.
Original Mortgage
$400,000
Interest Rate
6.75%
Mortgage Type
Negative Amortization
Purchase Details
Closed on
Apr 3, 2003
Sold by
Forgey Gregory S
Bought by
Rincon Jeffrey M and Rincon Candice M
Home Financials for this Owner
Home Financials are based on the most recent Mortgage that was taken out on this home.
Original Mortgage
$204,725
Interest Rate
5.54%
Create a Home Valuation Report for This Property
The Home Valuation Report is an in-depth analysis detailing your home's value as well as a comparison with similar homes in the area
Home Values in the Area
Average Home Value in this Area
Purchase History
| Date | Buyer | Sale Price | Title Company |
|---|---|---|---|
| Guerra Florentino R | $250,000 | Chicago Title | |
| Rincon Jeffrey M | -- | Stewart Title Company | |
| Rincon Jeffrey M | $213,000 | Diversified Title & Escrow S |
Source: Public Records
Mortgage History
| Date | Status | Borrower | Loan Amount |
|---|---|---|---|
| Previous Owner | Guerra Florentino R | $199,900 | |
| Previous Owner | Rincon Jeffrey M | $400,000 | |
| Previous Owner | Rincon Jeffrey M | $204,725 |
Source: Public Records
Tax History Compared to Growth
Tax History
| Year | Tax Paid | Tax Assessment Tax Assessment Total Assessment is a certain percentage of the fair market value that is determined by local assessors to be the total taxable value of land and additions on the property. | Land | Improvement |
|---|---|---|---|---|
| 2025 | $3,486 | $320,166 | $112,057 | $208,109 |
| 2024 | $3,486 | $313,888 | $109,860 | $204,028 |
| 2023 | $3,390 | $307,733 | $107,706 | $200,027 |
| 2022 | $3,370 | $301,699 | $105,594 | $196,105 |
| 2021 | $3,305 | $295,784 | $103,524 | $192,260 |
| 2020 | $3,262 | $292,751 | $102,462 | $190,289 |
| 2019 | $3,205 | $287,011 | $100,453 | $186,558 |
| 2018 | $3,135 | $281,383 | $98,483 | $182,900 |
| 2017 | $3,079 | $275,866 | $96,552 | $179,314 |
| 2016 | $2,878 | $270,457 | $94,659 | $175,798 |
| 2015 | $2,820 | $266,394 | $93,237 | $173,157 |
| 2014 | $2,764 | $261,176 | $91,411 | $169,765 |
Source: Public Records
Map
Nearby Homes
- 2321 S Magnolia Ave Unit 6E
- 12321 Gardenia Place
- 1162 W Philadelphia St
- 12524 Ross Ave
- 12351 Twin Gables Dr
- 926 W Philadelphia St Unit 49
- 926 W Philadelphia St Unit R99
- 926 W Philadelphia St Unit 10
- 5610 Guardian Way
- 1726 S Mountain Ave Unit C
- 1712 S Mountain Ave Unit E
- 1706 S Mountain Ave
- 12638 Verdugo Ave
- 12811 Oaks Ave
- 12796 17th St
- 11782 Vernon Ave
- 558 W Philadelphia St
- 6542 Hamilton St
- 12689 Cypress Ave
- 1604 S Mountain Ave Unit D
- 12206 Fuschia Ave
- 12228 Fuschia Ave
- 12217 Mulberry Ave
- 12207 Mulberry Ave
- 12227 Mulberry Ave
- 12217 Fuschia Ave
- 1261 W Monticello St
- 12207 Fuschia Ave
- 1253 W Monticello St
- 12227 Fuschia Ave
- 1247 W Monticello St
- 1303 W Monticello St
- 1241 W Monticello St
- 5993 Portsmouth St
- 6009 Portsmouth St
- 6017 Portsmouth St
- 12206 St
- 12216 Mulberry Ave
- 12218 Elderberry St
- 12206 Mulberry Ave