Estimated Value: $1,092,000 - $1,293,000
About This Home
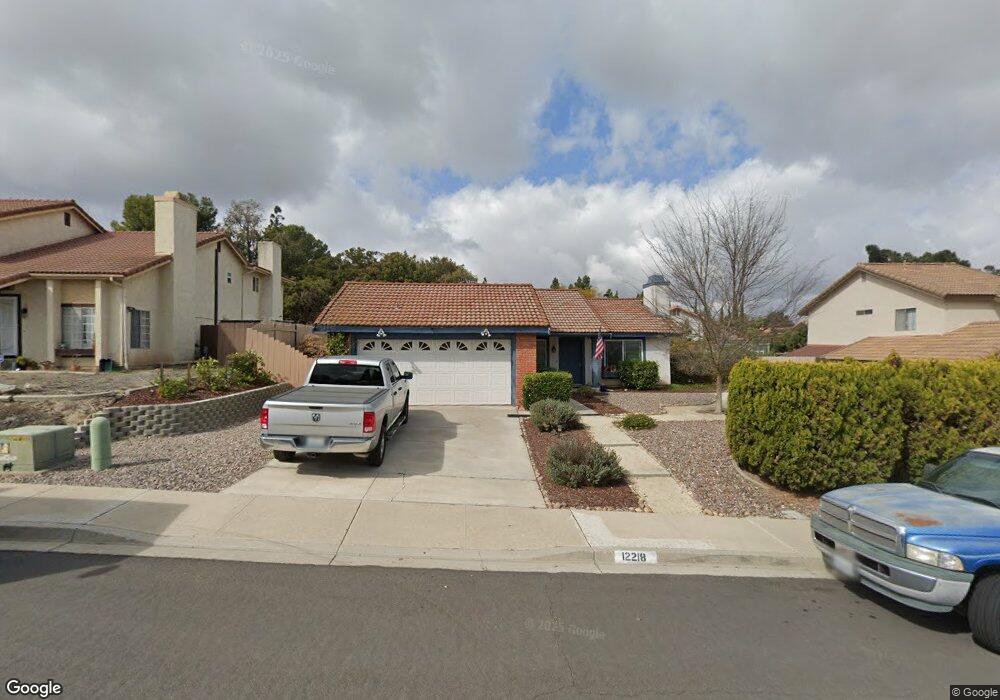
This home is located at 12218 Greentree Rd, Poway, CA 92064 and is currently estimated at $1,204,450, approximately $752 per square foot. 12218 Greentree Rd is a home located in San Diego County with nearby schools including Pomerado Elementary, Bernardo Heights Middle, and Rancho Bernardo High.
Ownership History
We collect this data history from publicly available records. To have your information removed, we recommend requesting removal directly through your county’s website.
Purchase Details
Home Financials for this Owner
Home Financials are based on the most recent Mortgage that was taken out on this home.Purchase Details
Purchase Details
Home Financials for this Owner
Home Financials are based on the most recent Mortgage that was taken out on this home.Purchase Details
Home Values in the Area
Average Home Value in this Area
Purchase History
We collect this data history from publicly available records. To have your information removed, we recommend requesting removal directly through your county’s website.
| Date | Buyer | Sale Price | Title Company |
|---|---|---|---|
| -- | Tsi | ||
| -- | Tsi | ||
| -- | None Available | ||
| $188,500 | Old Republic Title Company | ||
| $98,000 | -- |
Mortgage History
We collect this data history from publicly available records. To have your information removed, we recommend requesting removal directly through your county’s website.
| Date | Status | Borrower | Loan Amount |
|---|---|---|---|
| Open | $216,287 | ||
| Previous Owner | $127,000 |
Tax History
We collect this data history from publicly available records. To have your information removed, we recommend requesting removal directly through your county’s website.
| Year | Tax Paid | Tax Assessment Tax Assessment Total Assessment is a certain percentage of the fair market value that is determined by local assessors to be the total taxable value of land and additions on the property. | Land | Improvement |
|---|---|---|---|---|
| 2025 | $4,681 | $413,149 | $149,386 | $263,763 |
| 2024 | $4,681 | $405,049 | $146,457 | $258,592 |
| 2023 | $4,583 | $397,108 | $143,586 | $253,522 |
| 2022 | $4,508 | $389,322 | $140,771 | $248,551 |
| 2021 | $4,451 | $381,689 | $138,011 | $243,678 |
| 2020 | $4,393 | $377,776 | $136,596 | $241,180 |
| 2019 | $4,282 | $370,369 | $133,918 | $236,451 |
| 2018 | $4,165 | $363,108 | $131,293 | $231,815 |
| 2017 | $4,057 | $355,989 | $128,719 | $227,270 |
| 2016 | $3,976 | $349,010 | $126,196 | $222,814 |
| 2015 | $3,918 | $343,769 | $124,301 | $219,468 |
| 2014 | $3,829 | $337,036 | $121,867 | $215,169 |
Map
- Hawkeye Waverly Downs Way Unit A70
- 14955 Avenida Venusto Unit 26
- 14949 Amso St
- 0 La Manda Dr Unit 260002248
- 15031 Heath Dr
- 12327 Cornwallis Square Unit 118
- 15161 La Manda Dr
- 15024 Avenida Venusto Unit 151
- 12143 Stanwix Square
- 12144 Carrollton Square Unit 72
- 12166 Via Milano
- 12003 World Trade Dr Unit 3
- 12015 Alta Carmel Ct Unit 306
- 12059 Alta Carmel Ct Unit 168
- 12047 Alta Carmel Ct Unit 189
- 12067 Alta Carmel Ct Unit 72
- 12079 Alta Carmel Ct Unit 22
- 12333 Bachimba Ct
- 12075 Alta Carmel Ct Unit 35
- 14054 Via Corsini Unit 14
- 12210 Greentree Rd
- 12224 Greentree Rd
- 12209 Morningside Ct
- 12230 Greentree Rd
- 14877 Sunrise Dr
- 12202 Greentree Rd
- 12201 Morningside Ct
- 12217 Morningside Ct
- 14874 Morningside Dr
- 12221 Greentree Rd
- 14869 Sunrise Dr
- 14868 Morningside Dr
- 14879 Summerbreeze Way
- 14871 Summerbreeze Way
- 14863 Summerbreeze Way
- 14883 Summerbreeze Way
- 14865 Summerbreeze Way Unit 10
- 12211 Greentree Rd
- 14887 Summerbreeze Way
- 14857 Summerbreeze Way
Ask me questions while you tour the home.