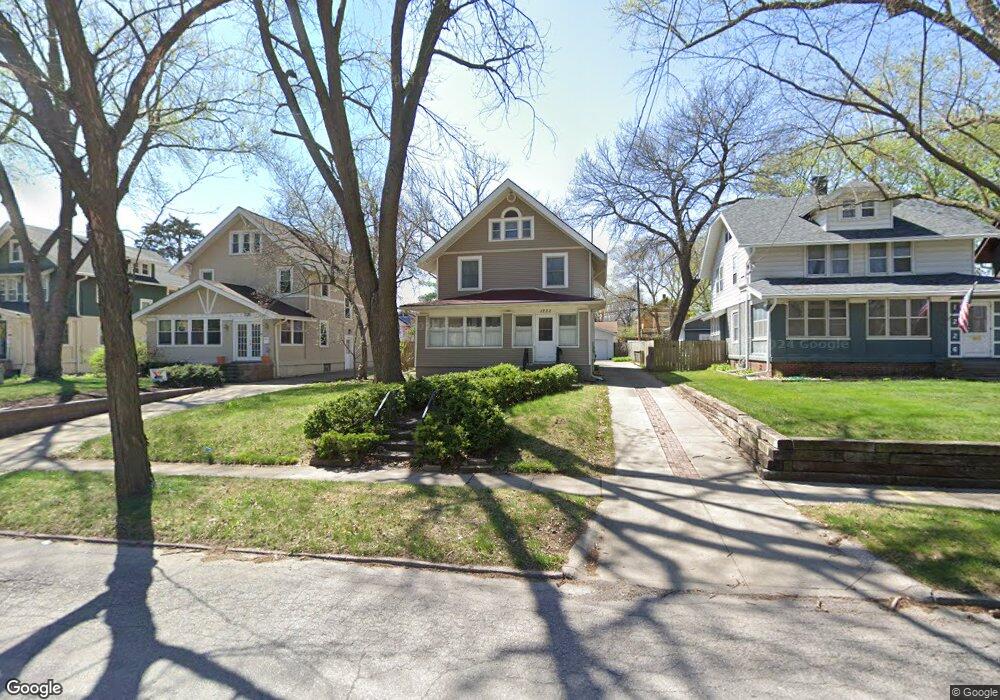
1222 41st St Des Moines, IA 50311
Drake NeighborhoodEstimated Value: $284,000 - $368,000
3
Beds
2
Baths
1,880
Sq Ft
$170/Sq Ft
Est. Value
About This Home
This home is located at 1222 41st St, Des Moines, IA 50311 and is currently estimated at $320,361, approximately $170 per square foot. 1222 41st St is a home located in Polk County with nearby schools including Perkins Elementary School, Merrill Middle School, and Roosevelt High School.
Ownership History
Date
Name
Owned For
Owner Type
Purchase Details
Closed on
Oct 5, 2004
Sold by
Deaton Tim
Bought by
Kaufman Karl
Current Estimated Value
Home Financials for this Owner
Home Financials are based on the most recent Mortgage that was taken out on this home.
Original Mortgage
$102,900
Outstanding Balance
$48,376
Interest Rate
5.12%
Mortgage Type
Purchase Money Mortgage
Estimated Equity
$271,985
Purchase Details
Closed on
Nov 10, 2003
Sold by
Klein Larry
Bought by
M D Faupel Land Trust and Deaton Tim
Purchase Details
Closed on
Oct 20, 2003
Sold by
M D Faupel Land Trust and Barrera Patricia
Bought by
Klein Larry
Purchase Details
Closed on
Aug 20, 2002
Sold by
Yes Properties Inc
Bought by
Cockburn David W
Create a Home Valuation Report for This Property
The Home Valuation Report is an in-depth analysis detailing your home's value as well as a comparison with similar homes in the area
Home Values in the Area
Average Home Value in this Area
Purchase History
| Date | Buyer | Sale Price | Title Company |
|---|---|---|---|
| Kaufman Karl | $144,500 | -- | |
| M D Faupel Land Trust | -- | -- | |
| Klein Larry | -- | -- | |
| Cockburn David W | -- | -- |
Source: Public Records
Mortgage History
| Date | Status | Borrower | Loan Amount |
|---|---|---|---|
| Open | Kaufman Karl | $102,900 |
Source: Public Records
Tax History Compared to Growth
Tax History
| Year | Tax Paid | Tax Assessment Tax Assessment Total Assessment is a certain percentage of the fair market value that is determined by local assessors to be the total taxable value of land and additions on the property. | Land | Improvement |
|---|---|---|---|---|
| 2025 | $4,732 | $282,100 | $57,300 | $224,800 |
| 2024 | $4,732 | $251,000 | $50,800 | $200,200 |
| 2023 | $5,628 | $251,000 | $50,800 | $200,200 |
| 2022 | $5,584 | $247,700 | $44,800 | $202,900 |
| 2021 | $5,402 | $247,700 | $44,800 | $202,900 |
| 2020 | $5,608 | $225,100 | $40,900 | $184,200 |
| 2019 | $5,128 | $225,100 | $40,900 | $184,200 |
| 2018 | $5,070 | $199,300 | $35,800 | $163,500 |
| 2017 | $4,676 | $199,300 | $35,800 | $163,500 |
| 2016 | $4,550 | $181,400 | $32,100 | $149,300 |
| 2015 | $4,550 | $181,400 | $32,100 | $149,300 |
| 2014 | $3,672 | $175,300 | $30,400 | $144,900 |
Source: Public Records
Map
Nearby Homes
- 4000 University Ave Unit 7
- 1206 39th St
- 3827 Carpenter Ave
- 3821 University Ave
- 1333 39th St
- 4036 Plainview Dr
- 1314 44th St
- 1347 44th St
- 1242 37th St
- 1503 42nd St
- 4200 Kingman Blvd
- 1534 41st St
- 1529 41st St
- 1008 Kingman Cir
- 1148 36th St
- 3919 Maquoketa Dr
- 1001 42nd St
- 1070 37th St
- 1415 46th St
- 1055 46th St