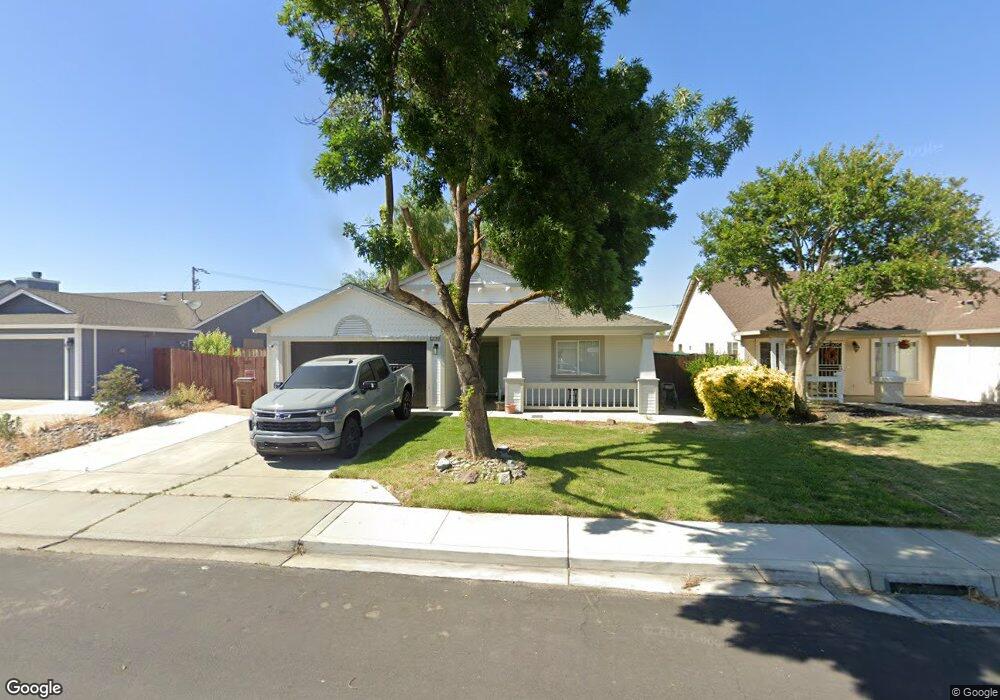
1222 Fetzer Ln Oakley, CA 94561
Estimated Value: $602,000 - $636,000
3
Beds
2
Baths
1,402
Sq Ft
$436/Sq Ft
Est. Value
About This Home
This home is located at 1222 Fetzer Ln, Oakley, CA 94561 and is currently estimated at $611,344, approximately $436 per square foot. 1222 Fetzer Ln is a home located in Contra Costa County with nearby schools including Vintage Parkway Elementary School, Delta Vista Middle School, and Freedom High School.
Ownership History
Date
Name
Owned For
Owner Type
Purchase Details
Closed on
May 9, 2024
Sold by
Breckenridge Property Fund 201
Bought by
Clinton Jordan
Current Estimated Value
Home Financials for this Owner
Home Financials are based on the most recent Mortgage that was taken out on this home.
Original Mortgage
$633,317
Outstanding Balance
$624,284
Interest Rate
6.79%
Mortgage Type
FHA
Estimated Equity
-$12,940
Purchase Details
Closed on
Jan 4, 2024
Sold by
Trustee Corps and Mtc Financial Inc
Bought by
Breckenridge Property Fund 201 and Fimby
Purchase Details
Closed on
Jun 2, 1999
Sold by
Jesse Stephen L
Bought by
Jesse Stephen L and Fimby Valorie Yolanda
Purchase Details
Closed on
Feb 23, 1999
Sold by
Oakley Avalon Lp
Bought by
Jesse Stephen L
Home Financials for this Owner
Home Financials are based on the most recent Mortgage that was taken out on this home.
Original Mortgage
$172,471
Interest Rate
6.78%
Mortgage Type
VA
Create a Home Valuation Report for This Property
The Home Valuation Report is an in-depth analysis detailing your home's value as well as a comparison with similar homes in the area
Home Values in the Area
Average Home Value in this Area
Purchase History
| Date | Buyer | Sale Price | Title Company |
|---|---|---|---|
| Clinton Jordan | $647,000 | Fidelity National Title Compan | |
| Breckenridge Property Fund 201 | $476,000 | None Listed On Document | |
| Jesse Stephen L | -- | Old Republic Title Company | |
| Jesse Stephen L | $167,500 | Old Republic Title Company |
Source: Public Records
Mortgage History
| Date | Status | Borrower | Loan Amount |
|---|---|---|---|
| Open | Clinton Jordan | $633,317 | |
| Previous Owner | Jesse Stephen L | $172,471 |
Source: Public Records
Tax History Compared to Growth
Tax History
| Year | Tax Paid | Tax Assessment Tax Assessment Total Assessment is a certain percentage of the fair market value that is determined by local assessors to be the total taxable value of land and additions on the property. | Land | Improvement |
|---|---|---|---|---|
| 2025 | $3,909 | $659,940 | $280,500 | $379,440 |
| 2024 | $3,870 | $257,262 | $56,852 | $200,410 |
| 2023 | $3,870 | $252,219 | $55,738 | $196,481 |
| 2022 | $3,843 | $247,275 | $54,646 | $192,629 |
| 2021 | $3,773 | $242,427 | $53,575 | $188,852 |
| 2019 | $3,526 | $235,238 | $51,987 | $183,251 |
| 2018 | $3,444 | $230,626 | $50,968 | $179,658 |
| 2017 | $3,417 | $226,105 | $49,969 | $176,136 |
| 2016 | $3,248 | $221,673 | $48,990 | $172,683 |
| 2015 | $3,267 | $218,345 | $48,255 | $170,090 |
| 2014 | $3,227 | $214,069 | $47,310 | $166,759 |
Source: Public Records
Map
Nearby Homes
- 1126 Deerpark Rd
- 336 Lakespring Place
- 321 Lakespring Place
- 201 Ohara Ave
- 9999 7th St
- 5053 Miguel Dr
- 4670 Fuschia Way
- 0 Main St Unit 41115212
- 521 Freemark Ln
- 0 Almond Dr Unit 41106452
- 4545 Waterford Way
- 1712 Domaine Way
- 736 Walnut Ranch Way
- 210 W Cypress Rd Unit 27
- 210 W Cypress Rd Unit 1
- 1809 Teresa Ln
- 317 Lorenz Dr
- 5210 Martin St
- 354 Hazelnut Ln
- 1859 Santa fe St
- 1214 Fetzer Ln
- 1230 Fetzer Ln
- 1221 Fetzer Ln
- 1225 Fetzer Ln
- 1217 Fetzer Ln
- 1210 Fetzer Ln
- 1213 Fetzer Ln
- 1229 Fetzer Ln
- 1209 Fetzer Ln
- 1206 Fetzer Ln
- 1238 Fetzer Ln
- 1240 Walnut Meadows Dr
- 1244 Walnut Meadows Dr
- 1236 Walnut Meadows Dr
- 1248 Walnut Meadows Dr
- 1232 Walnut Meadows Dr
- 1205 Fetzer Ln
- 1233 Fetzer Ln
- 1202 Fetzer Ln
- 1228 Walnut Meadows Dr