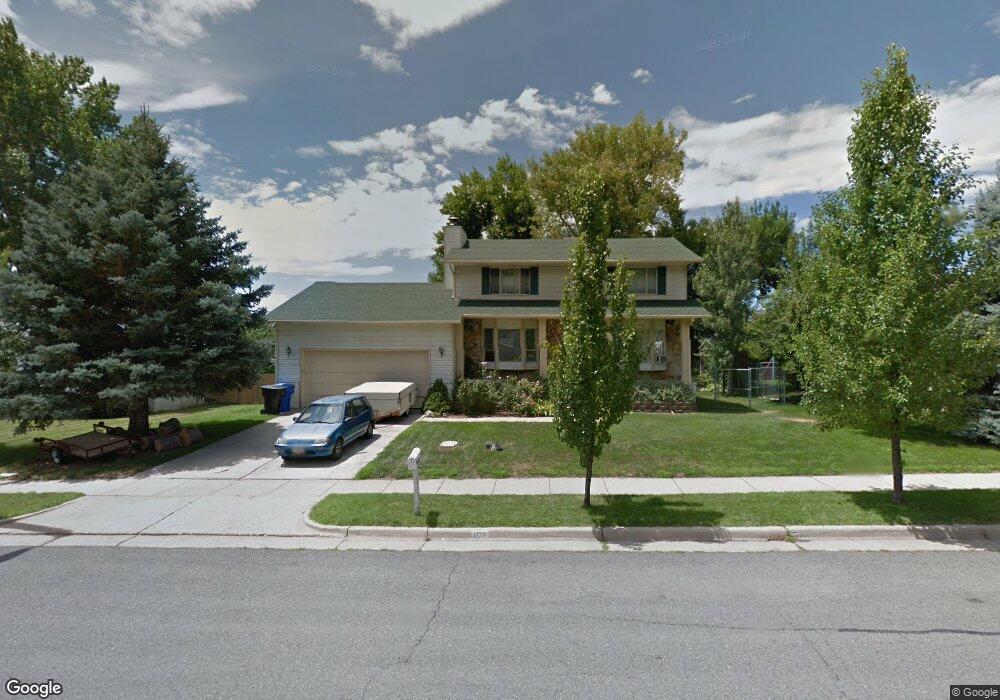
1222 S 120 E Farmington, UT 84025
Estimated Value: $575,000 - $620,000
4
Beds
4
Baths
2,410
Sq Ft
$247/Sq Ft
Est. Value
About This Home
This home is located at 1222 S 120 E, Farmington, UT 84025 and is currently estimated at $595,275, approximately $247 per square foot. 1222 S 120 E is a home located in Davis County with nearby schools including Reading School, Centerville Jr High, and Viewmont High School.
Ownership History
Date
Name
Owned For
Owner Type
Purchase Details
Closed on
Dec 14, 2002
Sold by
Morrow Jerry L and Morrow Carol J Nye
Bought by
Morrow Carol J Nye
Current Estimated Value
Home Financials for this Owner
Home Financials are based on the most recent Mortgage that was taken out on this home.
Original Mortgage
$123,900
Outstanding Balance
$51,678
Interest Rate
6.09%
Estimated Equity
$543,597
Purchase Details
Closed on
Oct 24, 2002
Sold by
Morrow Carol J Nye
Bought by
Morrow Jerry L and Morrow Carol J Nye
Home Financials for this Owner
Home Financials are based on the most recent Mortgage that was taken out on this home.
Original Mortgage
$123,900
Outstanding Balance
$51,678
Interest Rate
6.09%
Estimated Equity
$543,597
Purchase Details
Closed on
May 8, 2002
Sold by
Nye Morrow Carol J
Bought by
Morrow Jerry L and Nye Morrow Carol J
Home Financials for this Owner
Home Financials are based on the most recent Mortgage that was taken out on this home.
Original Mortgage
$123,900
Interest Rate
7.18%
Create a Home Valuation Report for This Property
The Home Valuation Report is an in-depth analysis detailing your home's value as well as a comparison with similar homes in the area
Home Values in the Area
Average Home Value in this Area
Purchase History
| Date | Buyer | Sale Price | Title Company |
|---|---|---|---|
| Morrow Carol J Nye | -- | -- | |
| Morrow Jerry L | -- | Bonneville Title Company Inc | |
| Morrow Carol J Nye | -- | Bonneville Title Company Inc | |
| Morrow Jerry L | -- | Backman Stewart Title Servic | |
| Nye Carol J | -- | Backman Stewart Title Servic |
Source: Public Records
Mortgage History
| Date | Status | Borrower | Loan Amount |
|---|---|---|---|
| Open | Morrow Carol J Nye | $123,900 | |
| Closed | Nye Carol J | $123,900 |
Source: Public Records
Tax History
| Year | Tax Paid | Tax Assessment Tax Assessment Total Assessment is a certain percentage of the fair market value that is determined by local assessors to be the total taxable value of land and additions on the property. | Land | Improvement |
|---|---|---|---|---|
| 2025 | $3,302 | $326,150 | $147,392 | $178,758 |
| 2024 | $2,949 | $294,800 | $143,814 | $150,986 |
| 2023 | $2,805 | $511,000 | $218,014 | $292,986 |
| 2022 | $2,855 | $295,350 | $108,185 | $187,165 |
| 2021 | $2,571 | $396,000 | $171,089 | $224,911 |
| 2020 | $2,337 | $351,000 | $146,937 | $204,063 |
| 2019 | $2,382 | $347,000 | $147,932 | $199,068 |
| 2018 | $2,223 | $319,000 | $142,522 | $176,478 |
| 2016 | $2,089 | $154,330 | $67,684 | $86,646 |
| 2015 | $2,001 | $140,305 | $67,684 | $72,621 |
| 2014 | $1,884 | $135,723 | $67,684 | $68,039 |
| 2013 | -- | $122,444 | $37,291 | $85,153 |
Source: Public Records
Map
Nearby Homes
- 1243 Cannon Dr
- 943 Creekside Ct
- 19 E 1500 S
- 7 W Rice Ln
- 1597 S 200 E
- 1603 S 200 E
- 799 S Rice Rd
- 1692 Willow Creek Cir
- 431 E Greystone Dr
- 2340 N 650 W
- 359 E 700 S
- 2145 N Main St
- 136 W Summerhill Ln
- 2136 N 725 W
- 283 W Summerhill Ln
- 551 W Summerhill Ln
- 5 W Summerhill Ln
- 581 W Summerhill Ln
- 2132 N 725 W
- 488 S 10 W
Your Personal Tour Guide
Ask me questions while you tour the home.