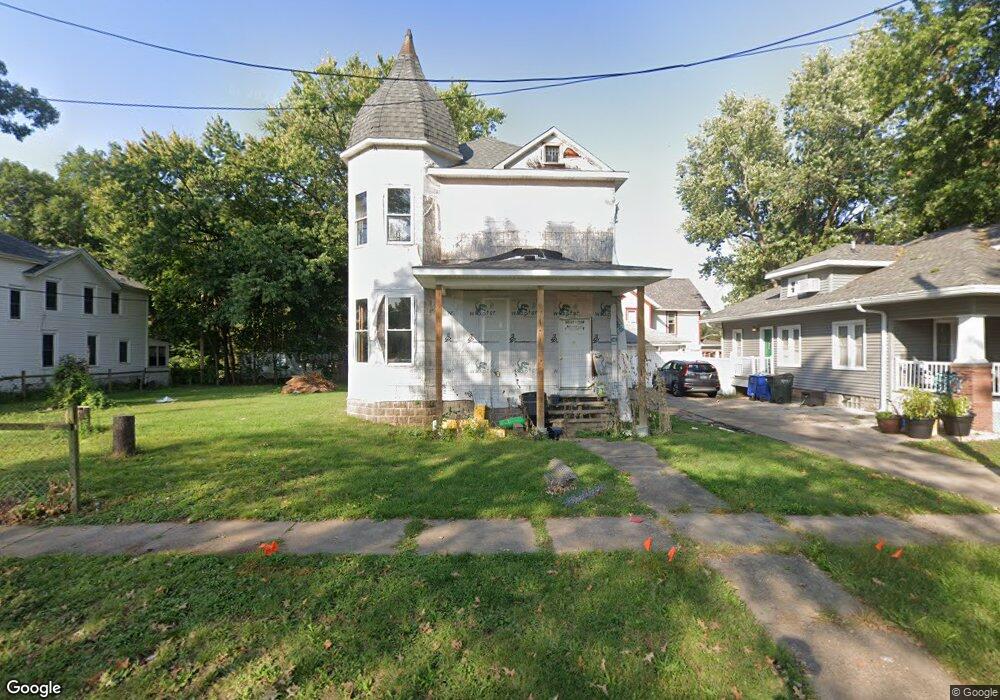
1222 Scott St Davenport, IA 52803
Central Davenport NeighborhoodEstimated Value: $67,000 - $143,000
2
Beds
1
Bath
1,726
Sq Ft
$60/Sq Ft
Est. Value
About This Home
This home is located at 1222 Scott St, Davenport, IA 52803 and is currently estimated at $103,534, approximately $59 per square foot. 1222 Scott St is a home located in Scott County with nearby schools including Jefferson Elementary School, Frank L. Smart Intermediate School, and Central High School.
Ownership History
Date
Name
Owned For
Owner Type
Purchase Details
Closed on
Mar 27, 2023
Sold by
Jepp Llc
Bought by
Farmer Tess
Current Estimated Value
Purchase Details
Closed on
Jan 24, 2011
Sold by
Citimortgage Inc
Bought by
Peeters James E and Peeters Jacob P
Purchase Details
Closed on
Apr 20, 2009
Sold by
Citimortgage Inc
Bought by
Secretary Of Housing & Urban Development
Purchase Details
Closed on
Mar 10, 2009
Sold by
Ashcroft Tonya M
Bought by
Citimortgage Inc
Create a Home Valuation Report for This Property
The Home Valuation Report is an in-depth analysis detailing your home's value as well as a comparison with similar homes in the area
Home Values in the Area
Average Home Value in this Area
Purchase History
Date | Buyer | Sale Price | Title Company |
---|---|---|---|
Farmer Tess | $15,000 | None Listed On Document | |
Peeters James E | -- | None Available | |
Secretary Of Housing & Urban Development | -- | None Available | |
Citimortgage Inc | $36,069 | None Available |
Source: Public Records
Tax History Compared to Growth
Tax History
Year | Tax Paid | Tax Assessment Tax Assessment Total Assessment is a certain percentage of the fair market value that is determined by local assessors to be the total taxable value of land and additions on the property. | Land | Improvement |
---|---|---|---|---|
2024 | $796 | $45,640 | $23,620 | $22,020 |
2023 | $534 | $45,640 | $23,620 | $22,020 |
2022 | $536 | $24,960 | $9,550 | $15,410 |
2021 | $536 | $24,960 | $9,550 | $15,410 |
2020 | $492 | $22,640 | $9,550 | $13,090 |
2019 | $502 | $22,350 | $9,550 | $12,800 |
2018 | $490 | $22,350 | $9,550 | $12,800 |
2017 | $516 | $22,350 | $9,550 | $12,800 |
2016 | $702 | $32,030 | $0 | $0 |
2015 | $702 | $39,590 | $0 | $0 |
2014 | $880 | $43,430 | $0 | $0 |
2013 | $948 | $0 | $0 | $0 |
2012 | -- | $40,890 | $13,660 | $27,230 |
Source: Public Records
Map
Nearby Homes