NOT LISTED FOR SALE

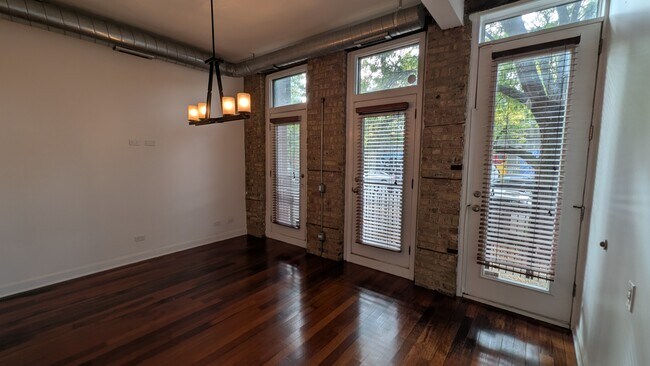
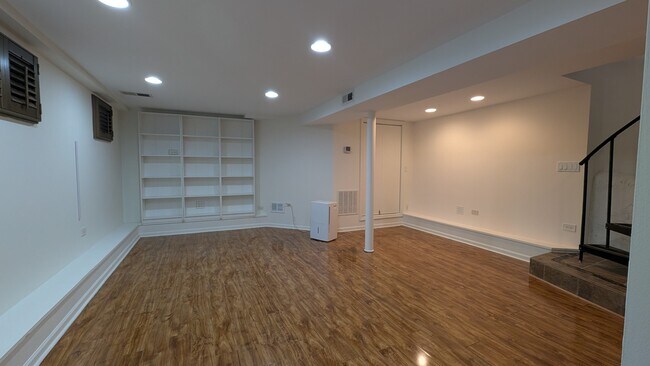
1222 W Hubbard St Unit 1F Chicago, IL 60642

West Town Neighborhood

Estimated Value: $392,000 - $569,000

2 Beds
2 Baths
1,240 Sq Ft
$390/Sq Ft Est. Value

About This Home

This home is located at 1222 W Hubbard St Unit 1F, Chicago, IL 60642 and is currently estimated at $484,004, approximately $390 per square foot. 1222 W Hubbard St Unit 1F is a home located in Cook County with nearby schools including Otis Elementary School, Wells Community Academy High School, and Rauner College Prep.

Ownership History

Date Name Owned For Owner Type

Purchase Details

Closed on
Jul 28, 2011
Sold by
Lasusa Frank T and Lasusa Roxanne
Bought by
Longmate Thomas G
Current Estimated Value
$484,004

Home Financials for this Owner

Home Financials are based on the most recent Mortgage that was taken out on this home.
Original Mortgage
$243,662
Outstanding Balance
$173,070
Interest Rate
4.75%
Mortgage Type
FHA
Estimated Equity
$283,717

Purchase Details

Closed on
Jul 24, 2006
Sold by
Jnk Properties Llc
Bought by
Lasusa Frank T

Home Financials for this Owner

Home Financials are based on the most recent Mortgage that was taken out on this home.
Original Mortgage
$48,108
Interest Rate
7.5%
Mortgage Type
Unknown
Source: Public Records

Range of Values:

Collateral Analytics

Collateral Analytics Collateral Analytics AVMs (Automated Valuation Model) employ a number of statistical approaches combined with neighborhood-specific comparable selection guarantees the most up-to-date and precise valuations.

Not Available

Collateral Analytics does not have data for the current month. Please view the chart for historical values.

ICE

ICE Mortgage Technology ICE Mortgage Technology’s AVM (Automated Valuation Model) is a state-of-the-art online residential property valuation tool that provides a quick and accurate estimate of the value of almost any home in the U.S.

Not Available

ICE Mortgage Technology does not have data for the current month. Please view the chart for historical values.

First American

First American First American Data & Analytics’ next-generation AVM combines unrivaled data assets with a blended ensemble of valuation models to produce highly accurate, reliable valuations you can trust.

Not Available

First American does not have data for the current month. Please view the chart for historical values.

Quantarium

Quantarium Quantarium’s valuation service, repeatedly proven the industry’s most accurate and comprehensive, is supercharged with a self-learning and auto-tuning AI engine that continually becomes smarter and more accurate as it processes daily inputs from the industry’s leading RE data lake.

Not Available

Quantarium does not have data for the current month. Please view the chart for historical values.

Average Value
Not Available
List Price
Sold Price
Create a Home Valuation Report for This Property
The Home Valuation Report is an in-depth analysis detailing your home's value as well as a comparison with similar homes in the area

Home Values in the Area

Source: Public Records

Average Home Value in this Area


Source: Public Records

Purchase History

Date Buyer Sale Price Title Company
Longmate Thomas G $250,000 Attorneys Title Guaranty Fun
Lasusa Frank T $239,000 Alliance Title Company
Source: Public Records

Mortgage History

Date Status Borrower Loan Amount
Open Longmate Thomas G $243,662
Previous Owner Lasusa Frank T $76,000
Previous Owner Lasusa Frank T $48,108
Previous Owner Lasusa Frank T $191,200
Source: Public Records

Tax History Compared to Growth

Source: Public Records

Tax History

Year Tax Paid Tax Assessment Tax Assessment Total Assessment is a certain percentage of the fair market value that is determined by local assessors to be the total taxable value of land and additions on the property. Land Improvement
2024 $3,773 $30,729 $3,533 $27,196
2023 $3,773 $21,767 $1,612 $20,155
2022 $3,773 $21,767 $1,612 $20,155
2021 $3,707 $21,766 $1,612 $20,154
2020 $4,062 $21,338 $1,612 $19,726
2019 $4,032 $23,499 $1,612 $21,887
2018 $3,963 $23,499 $1,612 $21,887
2017 $4,013 $22,016 $1,422 $20,594
2016 $3,909 $22,016 $1,422 $20,594
2015 $3,554 $22,016 $1,422 $20,594
2014 $3,621 $22,087 $1,209 $20,878
2013 $3,539 $22,087 $1,209 $20,878
Source: Public Records

Map