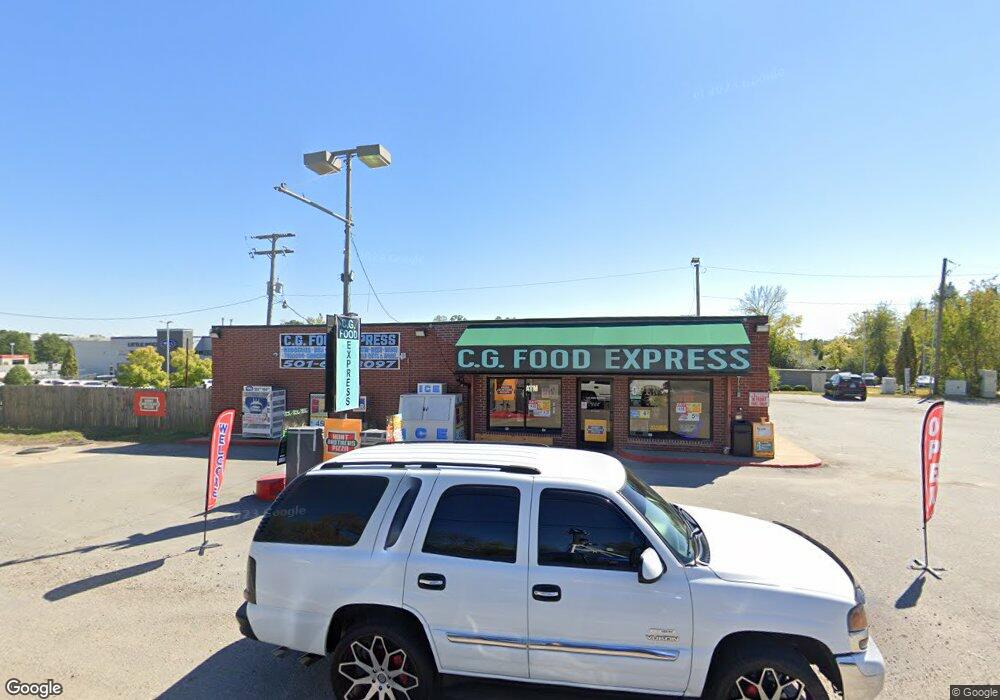
12223 Colonel Glenn Rd Little Rock, AR 72210
Western Little Rock NeighborhoodEstimated Value: $711,147
--
Bed
--
Bath
3,000
Sq Ft
$237/Sq Ft
Est. Value
About This Home
This home is located at 12223 Colonel Glenn Rd, Little Rock, AR 72210 and is currently estimated at $711,147, approximately $237 per square foot. 12223 Colonel Glenn Rd is a home located in Pulaski County with nearby schools including J.A. Fair K8 Preparatory School, Little Rock Southwest High School, and LISA Academy West Elementary School.
Ownership History
Date
Name
Owned For
Owner Type
Purchase Details
Closed on
Mar 21, 2023
Sold by
Joe Rickeys Enterprise Llc
Bought by
Eileen Llc
Current Estimated Value
Home Financials for this Owner
Home Financials are based on the most recent Mortgage that was taken out on this home.
Original Mortgage
$520,000
Outstanding Balance
$503,646
Interest Rate
6.12%
Mortgage Type
New Conventional
Estimated Equity
$207,501
Purchase Details
Closed on
Mar 16, 2023
Sold by
Yousef And Sana Alley Family Living Trus
Bought by
Joe Rickeys Enterprise Llc
Home Financials for this Owner
Home Financials are based on the most recent Mortgage that was taken out on this home.
Original Mortgage
$520,000
Outstanding Balance
$503,646
Interest Rate
6.12%
Mortgage Type
New Conventional
Estimated Equity
$207,501
Purchase Details
Closed on
Nov 1, 2019
Sold by
Alley Nader E
Bought by
Alley Yousef E and Alley Sana
Purchase Details
Closed on
Feb 18, 2018
Sold by
Alley Yousef E and Alley Sana
Bought by
Alley Yousef E and Alley Sana
Create a Home Valuation Report for This Property
The Home Valuation Report is an in-depth analysis detailing your home's value as well as a comparison with similar homes in the area
Home Values in the Area
Average Home Value in this Area
Purchase History
| Date | Buyer | Sale Price | Title Company |
|---|---|---|---|
| Eileen Llc | $650,000 | Lenders Title Company | |
| Joe Rickeys Enterprise Llc | $550,000 | Lenders Title Company | |
| Alley Yousef E | -- | None Available | |
| Alley Yousef E | -- | None Available |
Source: Public Records
Mortgage History
| Date | Status | Borrower | Loan Amount |
|---|---|---|---|
| Open | Eileen Llc | $520,000 |
Source: Public Records
Tax History Compared to Growth
Tax History
| Year | Tax Paid | Tax Assessment Tax Assessment Total Assessment is a certain percentage of the fair market value that is determined by local assessors to be the total taxable value of land and additions on the property. | Land | Improvement |
|---|---|---|---|---|
| 2025 | $6,293 | $89,907 | $54,871 | $35,036 |
| 2024 | $6,293 | $89,907 | $54,871 | $35,036 |
| 2023 | $6,293 | $89,907 | $54,871 | $35,036 |
| 2022 | $6,294 | $89,907 | $54,871 | $35,036 |
| 2021 | $6,417 | $91,020 | $36,700 | $54,320 |
| 2020 | $6,371 | $91,020 | $36,700 | $54,320 |
| 2019 | $3,984 | $91,020 | $36,700 | $54,320 |
| 2018 | $3,677 | $91,020 | $36,700 | $54,320 |
| 2017 | $3,370 | $91,020 | $36,700 | $54,320 |
| 2016 | $3,064 | $84,330 | $54,880 | $29,450 |
| 2015 | $2,454 | $54,880 | $54,880 | $0 |
| 2014 | $2,454 | $54,880 | $54,880 | $0 |
Source: Public Records
Map
Nearby Homes
- 12700 Lawson Rd
- 000 Colonel Glenn Ct
- 0 Colonel Glenn Ct
- 12600 Bertha Rd
- 26 Congressional Dr
- 13320 Colonel Glenn Rd
- 105 Sanibel Cir
- 0 Talley Rd
- 000 Talley Rd
- 0 Dollarway Dr Dr
- 56 Waters Edge Dr
- 8 Avant Garde Dr
- 3818 S Shackleford Rd
- 12 Woodfern Dr
- 14524 Lawson Rd
- 31 Avant Garde Dr
- 0 W Lake Ln Unit 25039270
- 0 W Lake Ln Unit 25039268
- 0 W Lake Ln Unit 25039267
- 0 W Lake Ln Unit 25039266
- 0 Colonel Glenn Rd Unit 16010604
- 0 Colonel Glenn Rd Unit 16015660
- 0 Colonel Glenn Rd Unit 20034585
- 0 Colonel Glenn Rd Unit 20034584
- 0 Colonel Glenn Rd Unit 17008351
- 0 Colonel Glenn Rd Unit 19012243
- 0 Colonel Glenn Rd Unit 17015114
- 0 Colonel Glenn Rd Unit 17030412
- 0 Colonel Glenn Rd Unit 17032260
- 0 Colonel Glenn Rd Unit 17003796
- 0 Colonel Glenn Rd Unit 17037069
- 0 Colonel Glenn Rd Unit 16036406
- 0 Colonel Glenn Rd Unit 17014873
- 0 Colonel Glenn Rd Unit 17019505
- 0 Colonel Glenn Rd Unit 20038171
- 0 Colonel Glenn Rd Unit 20022583
- 0 Colonel Glenn Rd Unit 20015972
- 0 Mandan Rd
- 0 Mandan Rd Unit 20009897
- 12121 Colonel Glenn Rd