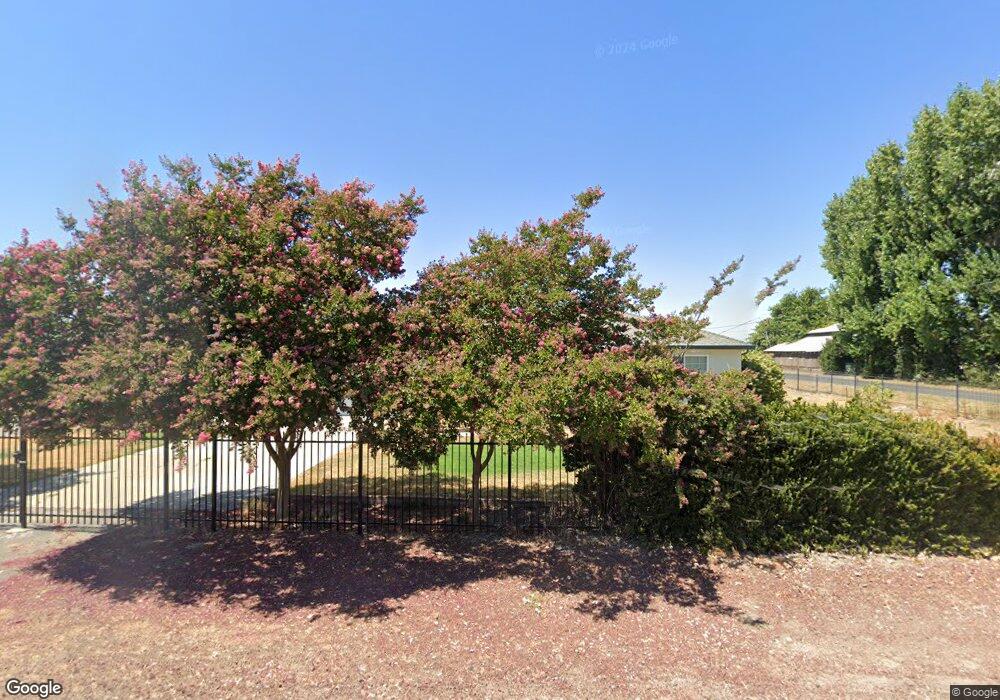
12225 S Union Rd Manteca, CA 95336
Estimated Value: $490,000 - $826,000
2
Beds
1
Bath
1,109
Sq Ft
$584/Sq Ft
Est. Value
About This Home
This home is located at 12225 S Union Rd, Manteca, CA 95336 and is currently estimated at $647,641, approximately $583 per square foot. 12225 S Union Rd is a home located in San Joaquin County with nearby schools including French Camp Elementary School, East Union High School, and BE.TECH Charter High School.
Ownership History
Date
Name
Owned For
Owner Type
Purchase Details
Closed on
Jul 15, 2013
Sold by
Phillips Richard M and Phillips Ernestine V
Bought by
Phillips Richard Anthony
Current Estimated Value
Home Financials for this Owner
Home Financials are based on the most recent Mortgage that was taken out on this home.
Original Mortgage
$186,400
Outstanding Balance
$137,580
Interest Rate
4.28%
Mortgage Type
Seller Take Back
Estimated Equity
$510,061
Purchase Details
Closed on
Nov 20, 2009
Sold by
Hayes Tara and Hayes Eric K
Bought by
Phillips Richard M and Phillips Ernestine V
Purchase Details
Closed on
Aug 2, 2007
Sold by
Phillips Richard M and Phillips Ernestine V
Bought by
Hayes Tara and Hayes Eric K
Home Financials for this Owner
Home Financials are based on the most recent Mortgage that was taken out on this home.
Original Mortgage
$250,000
Interest Rate
6.74%
Mortgage Type
Seller Take Back
Purchase Details
Closed on
Jan 17, 2002
Sold by
Phillips Richard M and Phillips Ernestine V
Bought by
Phillips Richard M and Phillips Ernestine V
Create a Home Valuation Report for This Property
The Home Valuation Report is an in-depth analysis detailing your home's value as well as a comparison with similar homes in the area
Home Values in the Area
Average Home Value in this Area
Purchase History
| Date | Buyer | Sale Price | Title Company |
|---|---|---|---|
| Phillips Richard Anthony | $192,000 | None Available | |
| Phillips Richard M | $300,000 | None Available | |
| Hayes Tara | $300,000 | None Available | |
| Phillips Richard M | -- | -- | |
| Phillips Richard M | -- | -- |
Source: Public Records
Mortgage History
| Date | Status | Borrower | Loan Amount |
|---|---|---|---|
| Open | Phillips Richard Anthony | $186,400 | |
| Previous Owner | Hayes Tara | $250,000 |
Source: Public Records
Tax History Compared to Growth
Tax History
| Year | Tax Paid | Tax Assessment Tax Assessment Total Assessment is a certain percentage of the fair market value that is determined by local assessors to be the total taxable value of land and additions on the property. | Land | Improvement |
|---|---|---|---|---|
| 2025 | $2,706 | $235,355 | $147,098 | $88,257 |
| 2024 | $2,624 | $230,741 | $144,214 | $86,527 |
| 2023 | $2,589 | $226,218 | $141,387 | $84,831 |
| 2022 | $2,551 | $221,783 | $138,615 | $83,168 |
| 2021 | $2,524 | $217,436 | $135,898 | $81,538 |
| 2020 | $2,426 | $215,207 | $134,505 | $80,702 |
| 2019 | $2,395 | $210,988 | $131,868 | $79,120 |
| 2018 | $2,364 | $206,852 | $129,283 | $77,569 |
| 2017 | $2,330 | $202,798 | $126,749 | $76,049 |
| 2016 | $2,275 | $198,823 | $124,264 | $74,559 |
| 2015 | $2,212 | $195,837 | $122,398 | $73,439 |
| 2014 | $2,069 | $192,000 | $120,000 | $72,000 |
Source: Public Records
Map
Nearby Homes
- 12484 S Union Rd
- 11385 S Union Rd
- 2521 Coelho Rd
- 1377 Arbor Brook Dr
- 1665 River Birch St
- 2961 Clear Point Way
- 1626 River Birch St
- 2970 Cotton Briar Ln
- 1842 E Palm Tree Ln
- 1266 Shady Pines St
- 1672 Arbor Brook Dr
- 2690 Steeple Run Ln
- 2679 Glen Echo Ln
- 2671 Glen Echo Ln
- 1040 Birch Run Way
- 13120 S Frontage Rd
- 2628 Glen Echo Ln
- 2558 Edgebrook Ln
- 1072 Glen Abbey Dr
- 2592 Shadow Berry Dr
- 12277 S Union Rd
- 12187 S Union Rd
- 12118 S Union Rd
- 2520 Coelho Rd
- 12430 S Union Rd
- 2506 Coelho Rd
- 11990 S Union Rd
- 12522 S Union Rd
- 11900 S Union Rd
- 2801 Lovelace Rd
- 11809 S Union Rd
- 11845 S Union Rd
- 2404 Coelho Rd
- 11727 S Union Rd
- 2808 Lovelace Rd
- 11719 S Union Rd
- 2727 Lovelace Rd
- 2551 Lovelace Rd
- 11708 S Union Rd
- 2350 Coelho Rd