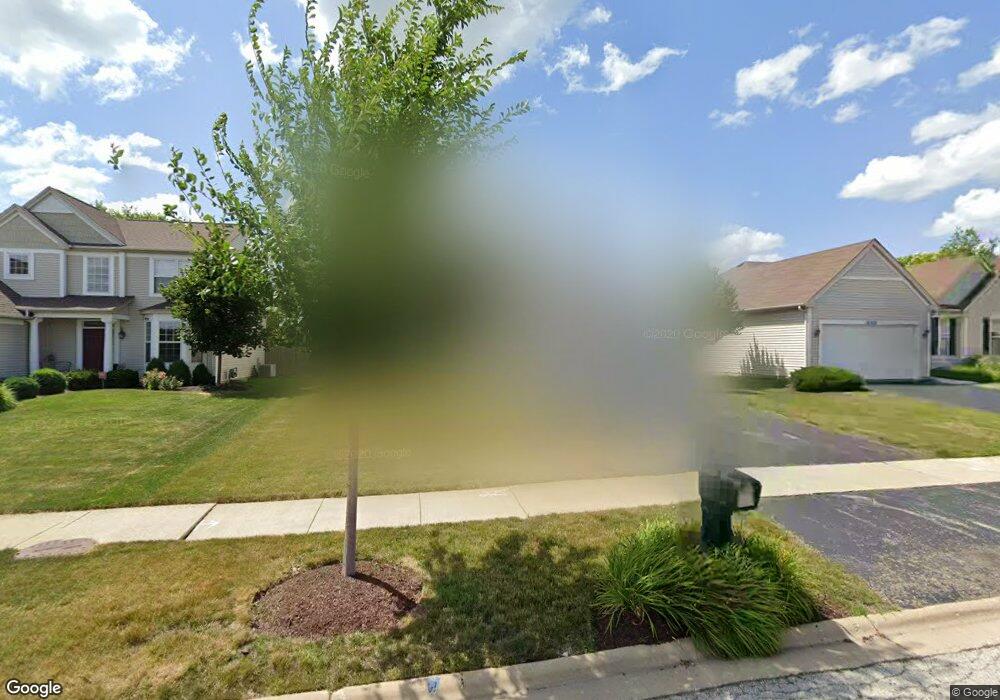
12226 Pear Tree Way Plainfield, IL 60585
North Plainfield NeighborhoodEstimated Value: $490,000 - $521,000
4
Beds
3
Baths
2,478
Sq Ft
$204/Sq Ft
Est. Value
About This Home
This home is located at 12226 Pear Tree Way, Plainfield, IL 60585 and is currently estimated at $506,468, approximately $204 per square foot. 12226 Pear Tree Way is a home located in Will County with nearby schools including Eagle Pointe Elementary School, Wentworth Intermediate School, and Heritage Grove Middle School.
Ownership History
Date
Name
Owned For
Owner Type
Purchase Details
Closed on
Sep 17, 2019
Sold by
Special Support North America Llc
Bought by
Yasin Samia Reem and Yasin Abraham Abdel
Current Estimated Value
Home Financials for this Owner
Home Financials are based on the most recent Mortgage that was taken out on this home.
Original Mortgage
$285,000
Outstanding Balance
$251,003
Interest Rate
3.87%
Mortgage Type
New Conventional
Estimated Equity
$255,465
Purchase Details
Closed on
Aug 30, 2018
Sold by
Pace Scott D and Pace Sara E
Bought by
Special Support North America Llc
Purchase Details
Closed on
Feb 1, 2000
Sold by
Pasquinelli Inc
Bought by
Pace Scott D and Pace Sara E
Home Financials for this Owner
Home Financials are based on the most recent Mortgage that was taken out on this home.
Original Mortgage
$212,657
Interest Rate
8.27%
Mortgage Type
FHA
Create a Home Valuation Report for This Property
The Home Valuation Report is an in-depth analysis detailing your home's value as well as a comparison with similar homes in the area
Home Values in the Area
Average Home Value in this Area
Purchase History
| Date | Buyer | Sale Price | Title Company |
|---|---|---|---|
| Yasin Samia Reem | $300,000 | Attorney | |
| Special Support North America Llc | $239,000 | Attorney | |
| Pace Scott D | $240,000 | Chicago Title Insurance Co |
Source: Public Records
Mortgage History
| Date | Status | Borrower | Loan Amount |
|---|---|---|---|
| Open | Yasin Samia Reem | $285,000 | |
| Previous Owner | Pace Scott D | $212,657 |
Source: Public Records
Tax History Compared to Growth
Tax History
| Year | Tax Paid | Tax Assessment Tax Assessment Total Assessment is a certain percentage of the fair market value that is determined by local assessors to be the total taxable value of land and additions on the property. | Land | Improvement |
|---|---|---|---|---|
| 2024 | $9,378 | $136,853 | $32,376 | $104,477 |
| 2023 | $9,378 | $120,895 | $28,601 | $92,294 |
| 2022 | $8,114 | $107,242 | $27,055 | $80,187 |
| 2021 | $7,810 | $102,136 | $25,767 | $76,369 |
| 2020 | $7,803 | $100,518 | $25,359 | $75,159 |
| 2019 | $7,683 | $97,685 | $24,644 | $73,041 |
| 2018 | $7,692 | $95,950 | $27,178 | $68,772 |
| 2017 | $7,650 | $93,473 | $26,476 | $66,997 |
| 2016 | $7,667 | $91,461 | $25,906 | $65,555 |
| 2015 | $8,442 | $87,944 | $24,910 | $63,034 |
| 2014 | $8,442 | $96,667 | $24,910 | $71,757 |
| 2013 | $8,442 | $96,667 | $24,910 | $71,757 |
Source: Public Records
Map
Nearby Homes
- 24181 Pear Tree Cir Unit 171206
- 24328 Whispering Trails Dr
- 24115 Pear Tree Cir Unit 170807
- 23236 W Teton Ln
- 12906 S Slate Ln
- 24333 Leski Ln
- 11723 Heritage Meadows Dr
- 24436 W Alexis Ln
- 24434 W Alexis Ln Unit 56400
- 11900 Winterberry Ln
- 24454 W Kroll Dr Unit 65397
- 24458 W Kroll Dr Unit 65395
- 12445 S 248th St
- 24420 W Alexis Ln Unit 55407
- 24506 W Kroll Dr Unit 66391
- 24418 W Alexis Ln Unit 67416
- 24505 W Kroll Dr Unit 67416
- 24412 W Alexis Ln Unit 54429
- 0 W 119th St
- 70AC W 119th St
- 12226 Peartree Way
- 12232 Pear Tree Way
- 12220 Pear Tree Way
- 12238 Pear Tree Way
- 12214 Pear Tree Way
- 12219 Shagbark Dr
- 12213 Shagbark Dr Unit 2
- 12231 Shagbark Dr Unit 2
- 12207 Shagbark Dr
- 12208 Pear Tree Way
- 12244 Pear Tree Way
- 12203 Shagbark Dr
- 12202 Pear Tree Way
- 24309 Shagbark Dr Unit 2
- 12250 Pear Tree Way
- 12163 Shagbark Dr Unit 2
- 24304 Hemlock Dr
- 12158 Pear Tree Way
- 12214 Shagbark Dr
- 24313 Shagbark Dr