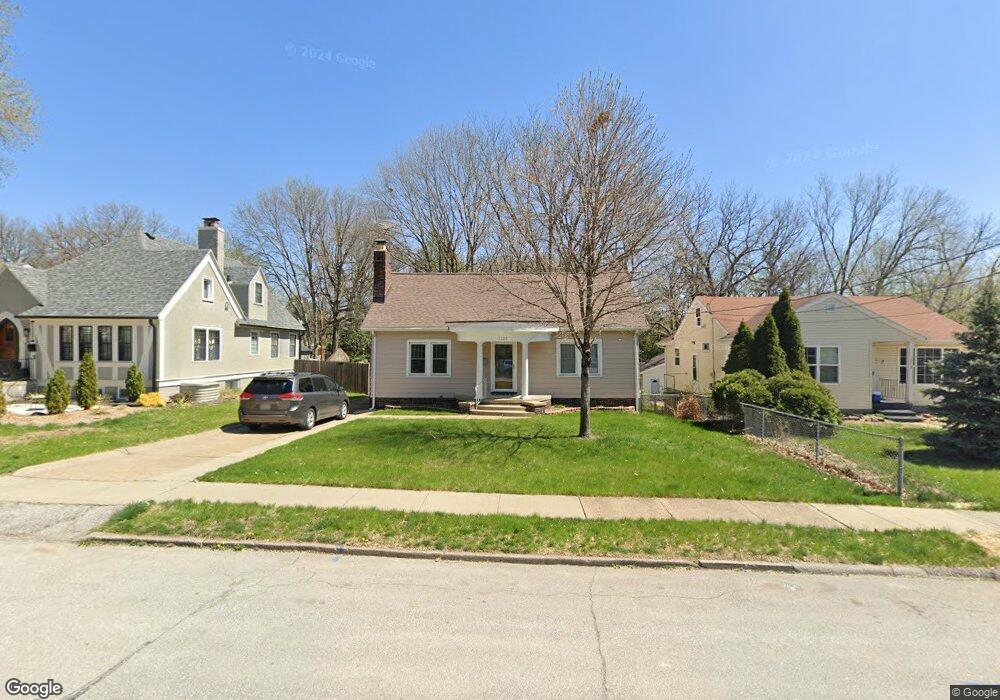
1223 40th St Des Moines, IA 50311
Drake NeighborhoodEstimated Value: $220,144 - $247,000
2
Beds
1
Bath
1,264
Sq Ft
$189/Sq Ft
Est. Value
About This Home
This home is located at 1223 40th St, Des Moines, IA 50311 and is currently estimated at $238,286, approximately $188 per square foot. 1223 40th St is a home located in Polk County with nearby schools including Perkins Elementary School, Merrill Middle School, and Roosevelt High School.
Ownership History
Date
Name
Owned For
Owner Type
Purchase Details
Closed on
Sep 9, 2005
Sold by
Pattinson Jill C
Bought by
Goodman Joshua and Goodman Carrie
Current Estimated Value
Home Financials for this Owner
Home Financials are based on the most recent Mortgage that was taken out on this home.
Original Mortgage
$92,700
Outstanding Balance
$46,996
Interest Rate
5.12%
Mortgage Type
Fannie Mae Freddie Mac
Estimated Equity
$191,290
Purchase Details
Closed on
Jun 12, 2002
Sold by
Lorentzen Jennifer A
Bought by
Pattinson Jill C
Home Financials for this Owner
Home Financials are based on the most recent Mortgage that was taken out on this home.
Original Mortgage
$96,000
Interest Rate
6.87%
Purchase Details
Closed on
Feb 29, 2000
Sold by
Scott Lester G and Scott Lester Gene
Bought by
Lorentzen Jennifer A
Home Financials for this Owner
Home Financials are based on the most recent Mortgage that was taken out on this home.
Original Mortgage
$83,600
Interest Rate
7.5%
Create a Home Valuation Report for This Property
The Home Valuation Report is an in-depth analysis detailing your home's value as well as a comparison with similar homes in the area
Home Values in the Area
Average Home Value in this Area
Purchase History
| Date | Buyer | Sale Price | Title Company |
|---|---|---|---|
| Goodman Joshua | $115,500 | -- | |
| Pattinson Jill C | $95,500 | -- | |
| Lorentzen Jennifer A | $87,500 | -- |
Source: Public Records
Mortgage History
| Date | Status | Borrower | Loan Amount |
|---|---|---|---|
| Open | Goodman Joshua | $92,700 | |
| Previous Owner | Pattinson Jill C | $96,000 | |
| Previous Owner | Lorentzen Jennifer A | $83,600 |
Source: Public Records
Tax History Compared to Growth
Tax History
| Year | Tax Paid | Tax Assessment Tax Assessment Total Assessment is a certain percentage of the fair market value that is determined by local assessors to be the total taxable value of land and additions on the property. | Land | Improvement |
|---|---|---|---|---|
| 2025 | $3,840 | $219,400 | $55,500 | $163,900 |
| 2024 | $3,840 | $195,200 | $49,100 | $146,100 |
| 2023 | $3,908 | $195,200 | $49,100 | $146,100 |
| 2022 | $3,878 | $165,800 | $43,400 | $122,400 |
| 2021 | $3,768 | $165,800 | $43,400 | $122,400 |
| 2020 | $3,914 | $151,000 | $39,600 | $111,400 |
| 2019 | $3,574 | $151,000 | $39,600 | $111,400 |
| 2018 | $3,538 | $133,000 | $34,700 | $98,300 |
| 2017 | $3,242 | $133,000 | $34,700 | $98,300 |
| 2016 | $3,160 | $119,900 | $31,100 | $88,800 |
| 2015 | $3,160 | $119,900 | $31,100 | $88,800 |
| 2014 | $2,898 | $109,100 | $28,200 | $80,900 |
Source: Public Records
Map
Nearby Homes
- 1206 39th St
- 4000 University Ave Unit 7
- 3821 University Ave
- 3827 Carpenter Ave
- 1333 39th St
- 1242 37th St
- 4036 Plainview Dr
- 1148 36th St
- 1070 37th St
- 1525 Germania Dr
- 1144 35th St
- 1347 44th St
- 1529 41st St
- 1314 44th St
- 1503 42nd St
- 1534 41st St
- 4200 Kingman Blvd
- 1008 Kingman Cir
- 4210 Kingman Blvd
- 1001 42nd St