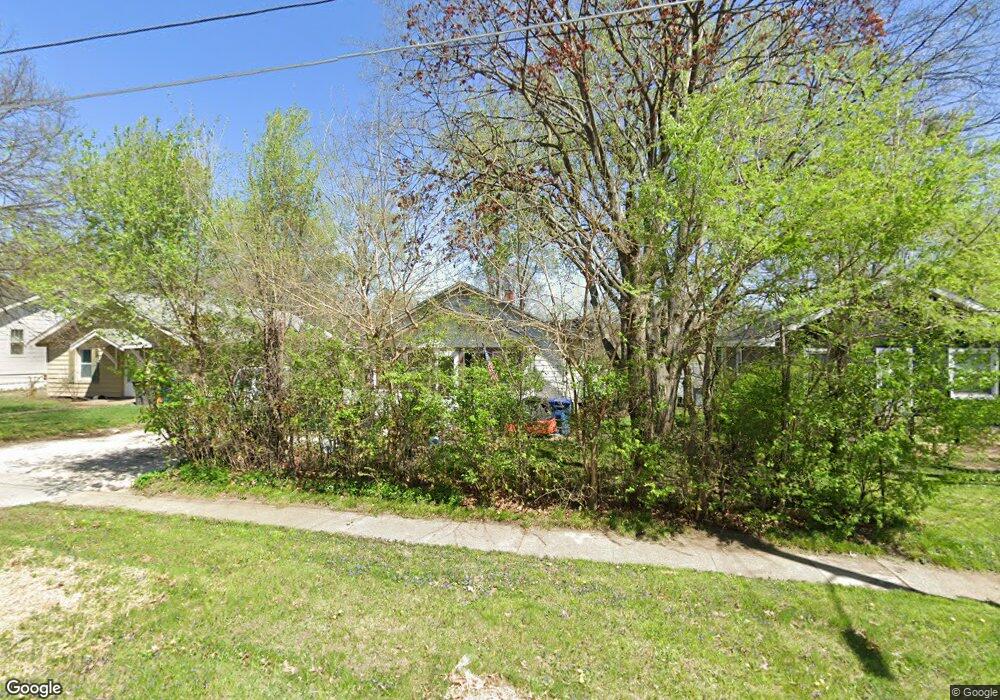
1223 56th St Des Moines, IA 50311
Merle Hay NeighborhoodEstimated Value: $156,740 - $179,000
2
Beds
1
Bath
788
Sq Ft
$212/Sq Ft
Est. Value
About This Home
This home is located at 1223 56th St, Des Moines, IA 50311 and is currently estimated at $166,685, approximately $211 per square foot. 1223 56th St is a home located in Polk County with nearby schools including Windsor Elementary School, Merrill Middle School, and Roosevelt High School.
Ownership History
Date
Name
Owned For
Owner Type
Purchase Details
Closed on
Jan 14, 2020
Sold by
Schlott Abraham N and Schlott Kelly E
Bought by
Schlott Abraham N and The Abraham N Schlott Trust
Current Estimated Value
Purchase Details
Closed on
Mar 12, 2014
Sold by
Iowa Property Receiver Llc
Bought by
Schlott Abraham and Schlott Kelly E
Purchase Details
Closed on
Oct 28, 2013
Sold by
610 40Th Street Llc
Bought by
Iowa Property Receiver Llc
Purchase Details
Closed on
Jun 18, 1998
Sold by
Primo Acquisitions I Llc
Bought by
Tax Acquisitions Llc
Purchase Details
Closed on
Dec 31, 1997
Sold by
Ermels Martin J and Ermels Kathleen A
Bought by
Primo Acquisitions I L L C
Create a Home Valuation Report for This Property
The Home Valuation Report is an in-depth analysis detailing your home's value as well as a comparison with similar homes in the area
Home Values in the Area
Average Home Value in this Area
Purchase History
| Date | Buyer | Sale Price | Title Company |
|---|---|---|---|
| Schlott Abraham N | -- | None Available | |
| Schlott Abraham | $25,000 | None Available | |
| Iowa Property Receiver Llc | -- | None Available | |
| Tax Acquisitions Llc | -- | None Available | |
| Primo Acquisitions I L C | $23,000 | -- | |
| Primo Acquisitions I L L C | $23,097 | -- |
Source: Public Records
Tax History Compared to Growth
Tax History
| Year | Tax Paid | Tax Assessment Tax Assessment Total Assessment is a certain percentage of the fair market value that is determined by local assessors to be the total taxable value of land and additions on the property. | Land | Improvement |
|---|---|---|---|---|
| 2025 | $2,362 | $136,600 | $40,700 | $95,900 |
| 2024 | $2,362 | $120,100 | $35,800 | $84,300 |
| 2023 | $2,458 | $120,100 | $35,800 | $84,300 |
| 2022 | $2,440 | $104,300 | $32,300 | $72,000 |
| 2021 | $2,314 | $104,300 | $32,300 | $72,000 |
| 2020 | $2,404 | $92,700 | $28,800 | $63,900 |
| 2019 | $2,196 | $92,700 | $28,800 | $63,900 |
| 2018 | $2,174 | $81,700 | $25,100 | $56,600 |
| 2017 | $1,926 | $81,700 | $25,100 | $56,600 |
| 2016 | $1,752 | $71,200 | $21,900 | $49,300 |
| 2015 | $1,752 | $66,500 | $21,900 | $44,600 |
| 2014 | $2,012 | $75,700 | $20,200 | $55,500 |
Source: Public Records
Map
Nearby Homes